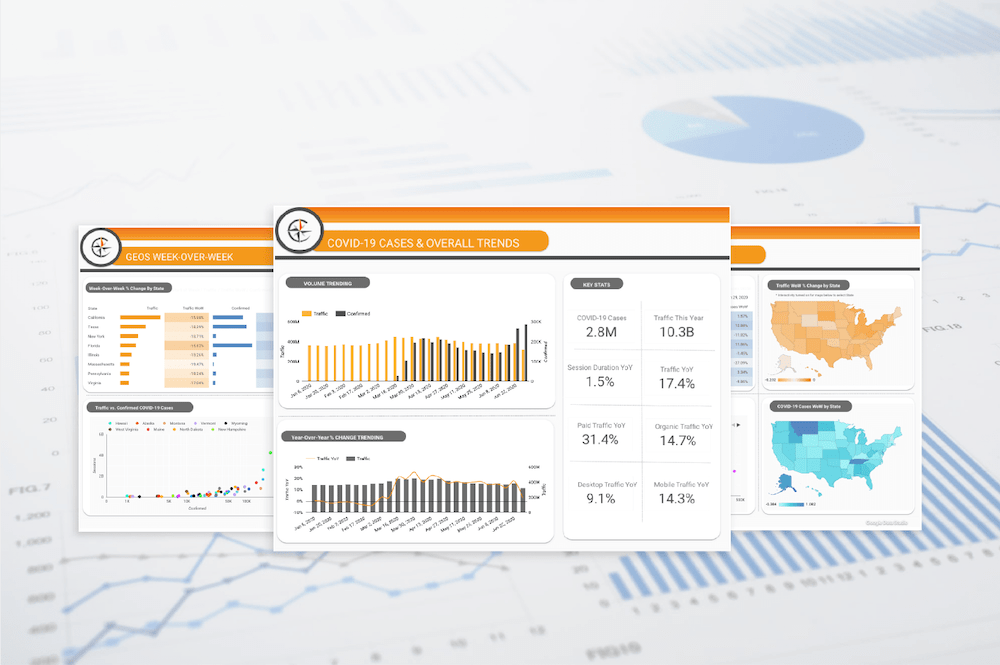
2020 has been a uniquely challenging year for businesses. We’re all aware of the struggles that small, local businesses are facing — especially ones that depend on in-store rather than online sales. However, as our 2020 Online Behavior Dashboard shows, the challenges posed by COVID-19 and social unrest aren’t impacting all businesses in the same way. In fact, many businesses — such as those in entertainment and media — are seeing increases in web traffic and engagement.
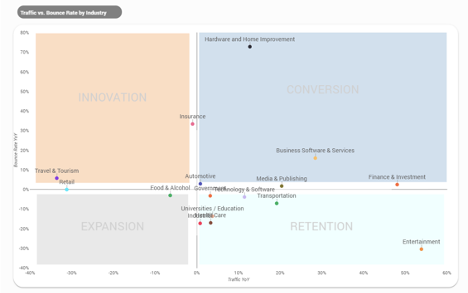
Many businesses continue to wrestle with the question of how to adjust to operate within a “new normal.” But the answer to that question greatly depends on the ways in which the challenges of 2020 are affecting a given organization. Our research shows that at the industry/vertical level, businesses fall into one of four categories, across which priorities and next steps will vary.
The Leader
Leaders (organizations in the Retention quadrant) are organizations receiving higher levels of web traffic and engagement due to shifting patterns of behavior in the COVID-era. These companies are likely to be found in entertainment, media, tech, and a few other verticals. For organizations fortunate enough to be enjoying this uptick in performance, the key question is: how do you ensure that this isn’t a one-time windfall? Now is the time to develop a strategic plan that works to not only onboard new customers but to retain them — and turn them into loyal, lifelong advocates — will help prevent organizations from falling back to the pack as the economy bounces back from the shocks of 2020.
The Opportunist
Opportunists (organizations in the Conversion quadrant) are businesses who have seen an uptick in traffic, but haven’t seen that translate into an increase in engagement, revenue, or profitability. As of mid-July, we see companies like these in finance, business software, and a handful of other industries. These companies should be placing a premium on testing and optimization. Perhaps they’re seeing new types of potential customers expressing interest, but haven’t yet figured out how to convert them. Now is the time to rapidly roll out an optimization plan so that a sudden, perhaps unexpected, increase in traffic volumes turns into a more meaningful increase in leads, customers, and sales.
The Climber
Climbers (organizations in the Expansion quadrant) are those who are experiencing declines in traffic, but improvements in engagement. This could be due to a variety of factors: less-qualified leads or customers no longer engaging, competitive pressures, or something else entirely. For these organizations, the question will be: how can we capitalize on an improvement in engagement while also scaling our customer base? Understanding the current customer base, then finding ways to reach similar audiences, should help these organizations find the efficient, profitable growth they need.
The Turnaround
Turnarounds (organizations in the Innovation quadrant) are perhaps the most visible category of businesses in the current climate. These are organizations — often in travel, tourism, or retail — experiencing a decline in traffic as well as a decline in engagement. Organizations in this situation may need a combination of approaches in order to innovate their way toward reversing downward trends. On the one hand, a focus on retention — similar to the Leaders — will help arrest the decline. At the same time, there’s a clear need for growth, just as there is for the Climbers. Finally, that growth has to be efficient, so there’s urgency behind an optimization program like the ones Opportunists should be implementing.
2020 has challenged many businesses in ways they haven’t been challenged before. But as a business decision-maker, before deciding what “treatments” to prescribe, it’s important to first diagnose the situation your business is in. Over the coming weeks, we’ll be diving deeper into each of the four business categories above to lay out a spectrum of approaches that can help businesses emerge from the COVID-era stronger than they were going into it.