
The Beginner's Guide To Google Analytics 4
Meet the new Google Analytics (GA4)
Introduction
There’s never been a more exciting — and more challenging — time to be a digital marketer. Across industries, business models, and verticals, customer journeys are continuing to shift into digital channels, making marketing more measurable and personal than ever. At the same time, there’s never been a more challenging time to be a digital marketer. Digital customer journeys are taking place across an ever-increasing number of screens and browsers, making customer unification and attribution more difficult. At the same time, changes in the technology and privacy landscape are causing a phenomenon we call “data deprecation,” raising new questions about what data can be collected — and how reliable that data might be. As a result, 2022 is a time of both unprecedented opportunities and unprecedented challenges. In this new world, marketers need a modern analytics platform specifically designed to address these challenges.
Google Analytics 4 (often referred to simply as “GA4”) is Google’s latest iteration of its well-known analytics platform, and it’s been specifically designed to address the challenges facing digital marketers today. In this Guide, we’ll lay out how GA4 differs from the legacy GA product (known as “Universal Analytics,” or just “UA”). More importantly, we’ll give you a taste for how GA4 can:
- Help you manage complex issues like consent and privacy;
- Enable you to embrace the new era of data modeling via built-in machine learning and artificial intelligence, and;
- Power modern marketing through the use of first-party data (1PD).
First, though, it’s worth briefly recapping the “back story” of Google Analytics.
Table of Contents
A Brief History of Google Analytics
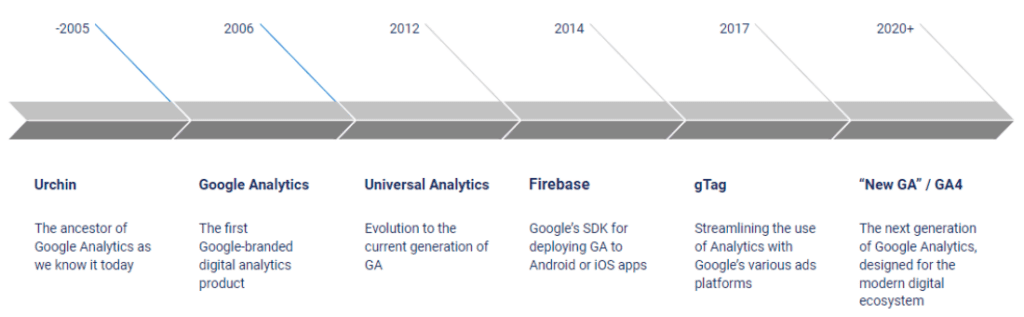
Google Analytics has a long history, particularly on an Internet/technology timescale. Google purchased Urchin in 2005, released “Urchin from Google” shortly thereafter, and rebranded the product to “Google Analytics” by 2006. The product has gone through a series of iterations over the years, of course, with the “Universal Analytics” version being released in 2012. And while Universal Analytics launched a wide variety of new features and product integrations over the years, the fact remains that Google’s fundamental analytics platform was a full decade old by the time GA4 was widely adopted.
As a result, Universal Analytics was not natively suited to address challenges that have come up in recent years, like the decline of third-party cookies, browser and operating system changes that make data collection more challenging, the increasing regulation of data privacy, etc. That’s why Google decided to build an all-new platform for Google Analytics — and that’s what we know now as GA4.
GA4 vs. Universal Analytics: A Platform Updated to Solve Modern Challenges
As you might expect with a from-the-ground-up rebuild of the Google Analytics platform, there are a lot of differences between GA4 and Universal Analytics. Throughout this guide, we’ll cover many of those differences. To get us started, though, it’s important to understand how GA4 is different when it comes to arguably the most fundamental aspect of the product: the data model.
Understanding the GA4 Data Model
Developing a strong understanding of the GA4 data model will help you make your GA4 deployment as valuable as possible. As we noted above, Universal Analytics dates from 2012, and Google Analytics overall is even older than that. Google Analytics, for example, predates smartphones. A consequence of this legacy is that GA’s data model was initially built for a world in which users browse web pages from desktop and laptop computers. Today, of course, we have smartphones, tablets, mobile apps, and many other ways to interact with brands. In order to bring the GA data model into the modern world, Google completely rebuilt it.
Universal Analytics had a strictly hierarchical data model. Users had sessions, which in turn were composed of pageviews and/or “events” (button clicks, video plays, etc.). Events themselves had a rigid model: they included a category name, an action name, and a label name — and that’s it.
In GA4, the data model is event-based, and is “flat” rather than hierarchical. We still have the concept of users, of course. But users simply have events — and those events can be used to track any interaction that occurs on your digital properties, whether web, app, or something else entirely. Furthermore, events now allow you to pass a wide variety of “parameters” that describe the event. No longer are you trapped within Universal Analytics’ rigid “Category/Action/Label” framework.
What does this mean for you? If your organization runs both websites and mobile apps, you’ll now have a data model for analytics that intentionally makes data capture consistent across your ecosystem. And even if you’re only using GA4 for a website or mobile app, you’ll have an event-based model which is vastly more flexible than the previous version. This means you can reimagine how your data capture works, the level of detail at which you want to track, and more.
With a basic understanding of GA4’s new data model under your belt, we can now shift our focus to a few key areas where it’s important to understand GA4’s capabilities.
Privacy, Consent, and Modeling: How GA4 Helps Address “Data Deprecation”
As discussed briefly above, “Data Deprecation” is an overarching term for a handful of different trends that are impacting organizations’ ability to collect, analyze, and act on data. As people all over the world have begun to care more about their privacy, the use of tools like ad blockers or tracking blockers has increased. In response to increasing consumer awareness and sensitivity around privacy, technology companies have made changes — at the browser and even the operating system levels — that affect data collection. The public sector is responding to these trends as well, in the form of new regulations popping up all over the world, like GPDR, CCPA, and many, many more.
This is the world we live in now; gone are the days where we took data collection for granted. The good news is that while there are a variety of newer limitations on which data we can collect, how we collect it, how we can use it, etc., GA4 equips us with various tools to navigate these challenges.
Consent Mode and Data Modeling
We would all be well-served to work from a fundamental assumption that data analytics is now contingent upon the consent of the user. However, the requirement to get consent for tracking creates an obvious question: what happens to the quality and reliability of data when some users decline to consent to tracking? Google is attempting to future-proof GA4 in terms of privacy, and there are two fundamental developments that Google has added.
The first is Consent Mode. In a nutshell, Consent Mode allows you to dynamically adjust data capture based on the consent status of the people visiting your website. As a result, while a certain degree of data loss is inevitable when users decline consent for tracking, marketers can feel confident that they’re collecting as much data as possible while respecting users’ choices.
The second is Data Modeling. When marketers lose the ability to directly observe behavior on their sites or apps, Data Modeling is a technique that can help to “fill the gaps” by applying machine learning to the data that is being directly observed.
Consent Mode helps you ensure that your data capture respects users’ wishes up front, and then Data Modeling fills in the gaps in observed data so that marketers can continue to be confident in making decisions based on their data. In this way, GA4 is working to equip marketers with actionable data despite new challenges in data capture.
New Privacy Features in GA4
In addition to Consent Mode and the data modeling that it enables, GA4 also comes with a variety of net-new privacy features. For example, you can use Data Redaction to proactively prevent the inadvertent collection of sensitive data like PII or PHI. In addition, you now have the ability to customize, on a country-by-country basis (or even a state-by-state basis within the U.S.), how GA4 collects certain types of data. GA4 has even made some specific updates to address privacy concerns stemming from the European Union.
The blog posts we’ve linked to above will help you understand these new privacy features in greater detail. For now, though, the primary takeaway is: when compared to the legacy Universal Analytics product, GA4 equips organizations with an array of new capabilities to help them respect users’ privacy whilst continuing to make data as actionable as possible.
Deriving Business Insights from GA4
Now that you understand some of the key aspects of how GA4 helps organizations tackle new challenges around Data Deprecation, let’s dive into the reporting interface itself.
Four Pillars of Reporting in Google Analytics 4
The left column of GA4 has icons that divide the interface into four sections: Reports, Explore, Advertising, and Configure. Each section starts with a snapshot page giving you an overview of that section. There is an abundance of reports in GA4 and many of them will look familiar to Universal Analytics users.
- Reports provide a view of the customer journey such as how users accessed your site, where they came from, what they are doing, and their retention.
- Explore is the advanced interface for custom reporting and sophisticated data visualizations.
- Advertising provides deeper insights into conversion performance and user journeys.
- Configure is where you manage your custom events and custom dimensions.
Reports
Lifecycle reports provide great insights into campaigns and user activity and include reports on acquisition, engagement, monetization, and retention.
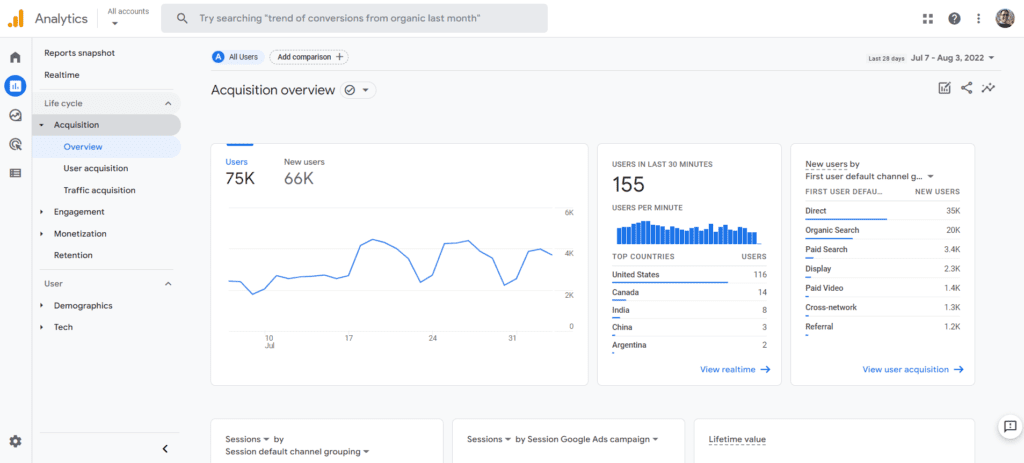
Acquisition: Shown below is the acquisition summary screen which highlights the various acquisition reports. The acquisition report shows information such as how users are getting to your site and which channels they are using. It includes reports on existing and new users, users in the last 30 minutes, which medium users are using or have come from, session types, and lifetime value. Each report summary can be clicked on to take drill downs and deep dives.
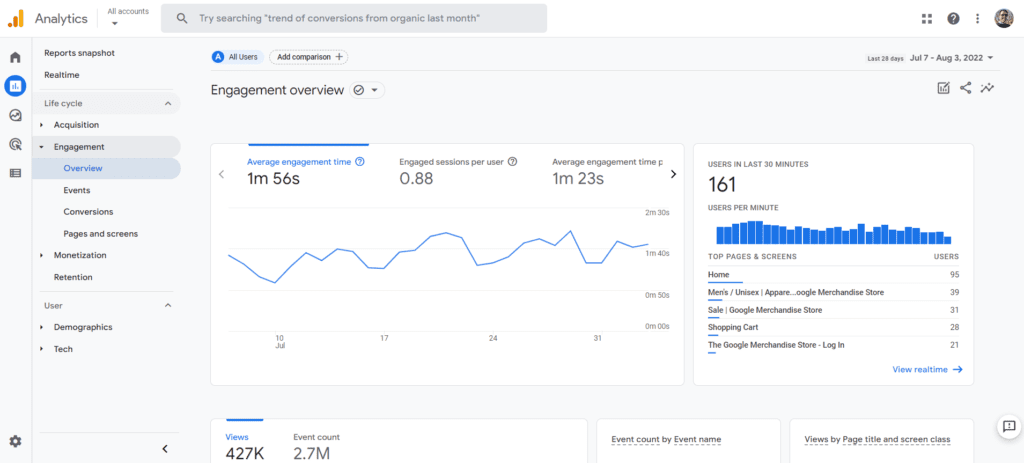
Engagement: Engagement reports show what users are doing with your site or app. The summary screen shown below has reports on items such as their engagement time, number of engaged sessions per user, and time per session. It shows users over time, views, and which pages they are viewing. It also shows user “stickiness,” a measure of how often users return.
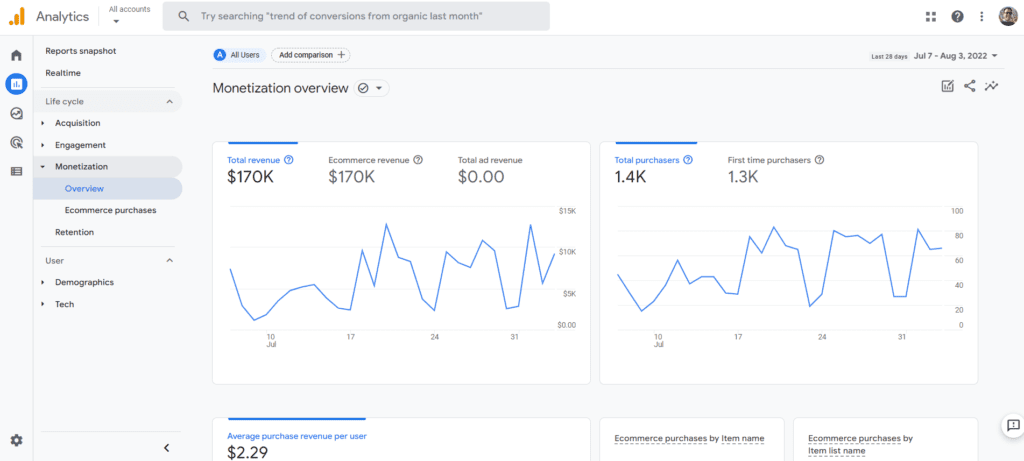
Monetization: The monetization tab shows how your site or app is creating revenue, either through purchases or advertising. This tab shows data like total revenue, number of purchasers, first-time purchasers, average revenue per user, top purchases by item, item views, coupons, and ad units.
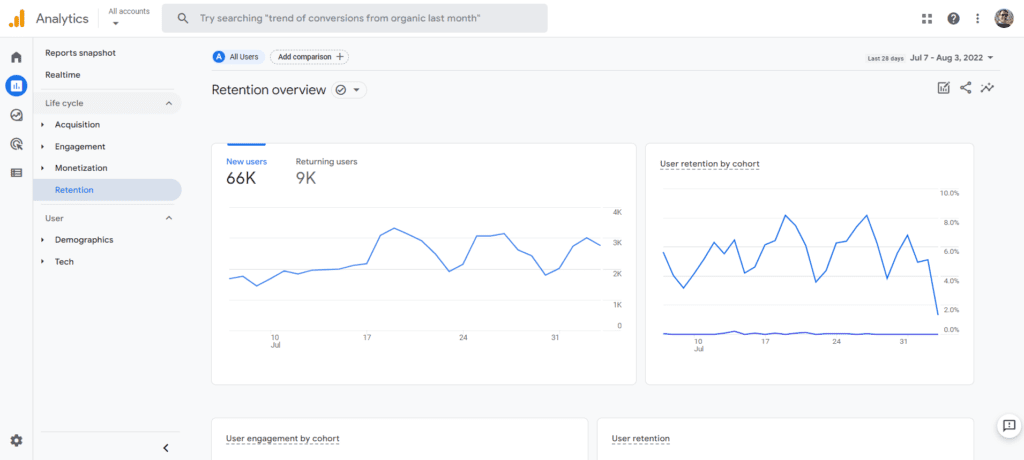
Retention: The retention report provides an overview of how many customers are returning. It compares new users to returning users and retention rates. It measures how long they are engaged when they return, retention over time, and lifetime value.
User Reports
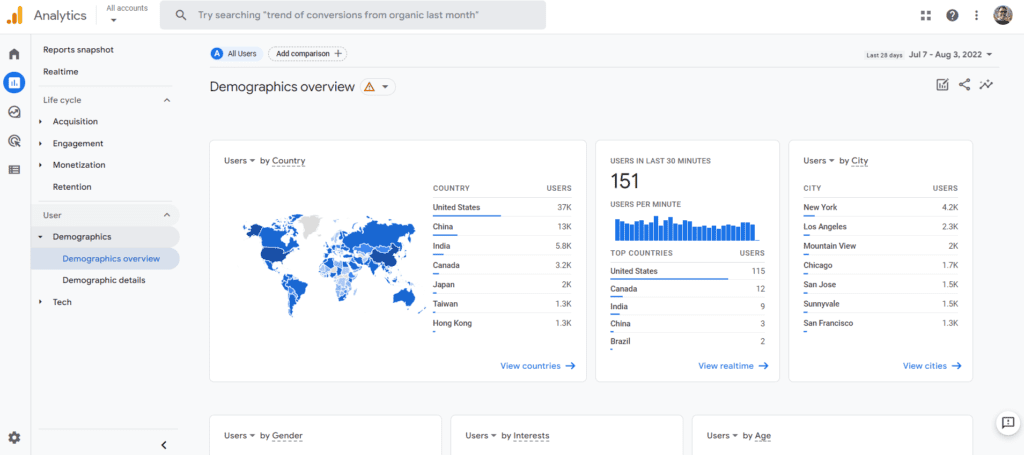
User reports show key information about the users who visit or use your site or app. Shown below is the summary screen which displays reports on key user demographics, such as users by country and city, gender, interests, age, and language. Google derives this data through a variety of means. Some metrics are gathered from hard data, such as a user’s language settings in their browser, and others are more abstractly inferred from best guesses (as informed by sophisticated AI), context, and past behavior. Each report can be sorted by different user types.
The user report also has a tech overview, which provides breakdowns of users by the platform they are using, their operating system (e.g., Windows, Mac, Android, etc.), device category (e.g., desktop, tablet, mobile), browser, screen resolution, app version, and other technical details.
Events Reports
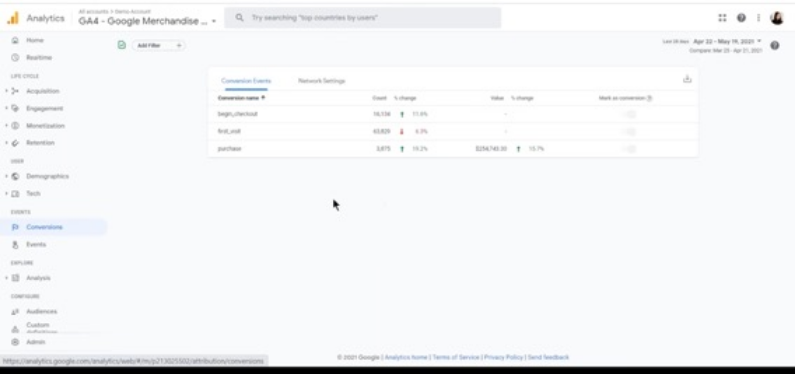
Event reports show specific actions or outcomes from users. The two tabs in this report are conversions and events.
Conversions: The conversion event report shows actions the user took, such as entering the checkout process, making a purchase, or making a first visit after seeing an advertisement. It also shows the level of change or level of performance compared to the past. These can be customized to show your most important conversion events.
Events: Like conversions, the events show other actions a user takes, typically on a smaller or more tactical level, such as changing account information, clicks, errors, or adding an item to the shopping cart. These can also be defined and customized. Event data can be compared to other event sets or historical data to show positive or negative change over time.
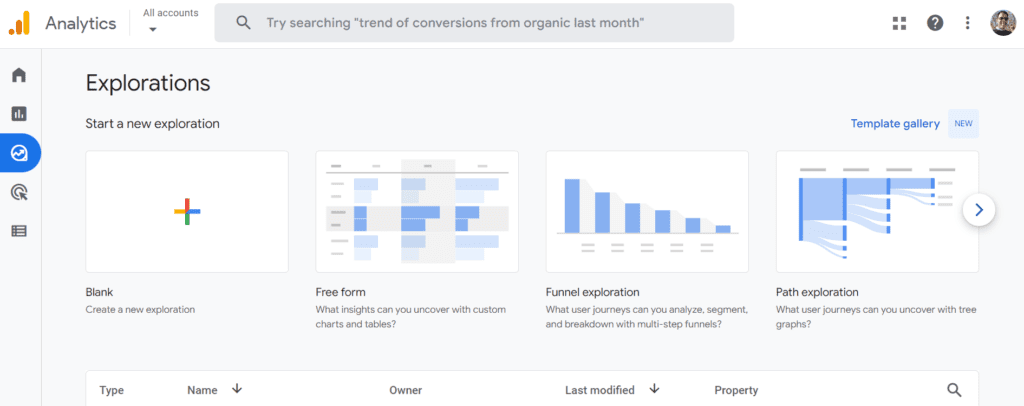
“Explore” Reports
Explore reports reside within their own dedicated section, and come with templates that provide graphical, intuitive visualizations of your data. The report templates come pre-formatted for specific techniques (e.g., segment overlap, path analysis, user timeline), use cases (e.g., acquisition, conversion), and industry specialties (e.g., ecommerce, gaming). Explorations are highly customizable, and intended to help make GA4 data fit an organization’s specific reporting needs. The interface provides multiple filters and segments that can be assigned. For visualizations, the interface provides a drag-and-drop style interface allowing the user to intuitively drop data fields into the graphic. Explorations also enable users to go much deeper into their data, looking at different data cuts of the user’s choice.
Each visualization can be an exciting feast of information and a serious creative customization project. Take a deep dive into learning about these after you are familiar with the basics of GA4.
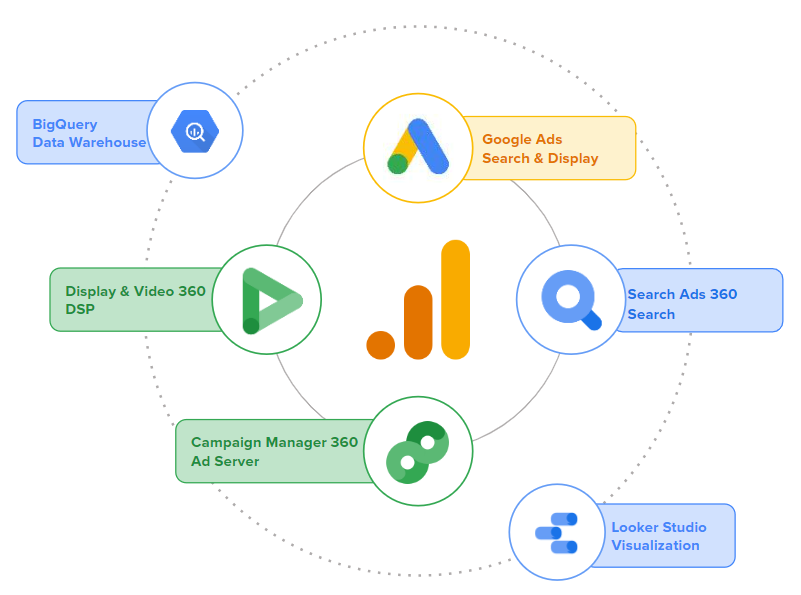
Powering Modern Marketing Across Google Marketing Platform (GMP)
GA4 isn’t only useful as a source of insights for the business — in fact, where GA4 really shines is as a “central nervous system” for orchestrating activity across the Google Marketing Platform. For example, audience segments that you create in GA4 can easily be “activated” (e.g. retargeted, shown more personalized creatives, etc.) through GMP platforms like SA360 and DV360. Furthermore, conversion data collected in GA4 can be used to power value-based bidding (VBB) and other advanced techniques across Google’s media-buying platforms.
And while this might all sound a bit similar to Universal Analytics — because, at a high level, it is — GA4 is adding innovative new capabilities to the well-known GMP integration story. For example, GA4’s predictive audiences feature enables organizations to directly tap into Google’s proprietary AI to create audiences such as “likely purchasers” or “likely churners,” who can then be targeted with customized messaging, optimized bidding strategies, and more.
Getting Started with Google Analytics 4
If you’re ready to get started with GA4, the good news is that the setup process is similar to the process you used to implement Universal Analytics. The GA4 demo account can serve as a helpful learning environment along the way. The guide Implementing Google Analytics 4 on Your Website will take you through the process in detail. In a nutshell, to get GA4 deployed on your website, you’ll want to:
- Create a new “GA4” property within your existing Google Analytics account.
- Add a web “data stream” to that new property.
- Deploy the GA4 tag via your Google Tag Manager (GTM) account, if you’re using GTM…
- …or directly implement the gtag.js tag on all the pages of your website.
One important note: We recommend that organizations get started with Google Analytics 4 in parallel to a pre-existing Universal Analytics implementation. We call this approach “dual tagging.” In other words, rather than immediately replacing Universal Analytics with Google Analytics 4, you will implement Google Analytics 4 side by side. This will allow you to keep working with Universal Analytics as long as you need, while you build familiarity with GA4. In addition, GA4 is still under active development at Google, and many important features have not been released yet. Setting up GA4 in parallel allows you to be ready to take advantage of those new features as soon as they’re built.
Conclusion
The proliferation of multi-device journeys, the fragmentation of marketing across ever-more channels, and the rise of “data deprecation” have combined to create significant new challenges for digital marketers in recent years. GA4 provides marketers with an analytics platform that’s been intentionally designed to help surmount these challenges. So, if you’ve been putting off diving deep into GA4, now is a great time to ramp up your knowledge of the platform and ensure you’re utilizing it to its full potential.
To take the next step with GA4, check out the wide variety of resources we’ve developed over time — and get in touch with us.
To dive deeper into the world of Google Analytics 4, explore our ever-growing list of resources:
General Migration Information & Getting Started
Integrations
Functionality & Features
- Roll-Up
Properties and Sub-Properties in GA4 - GA4
User Access and Administration - How
to Adapt to No “View” Feature in GA4 - GA4
Won’t Support IP Addresses. Now What? - Dynamic
Event Precedence in GA4 with BigQuery and Data Studio - Your
Guide to Navigating the GA4 Demo Account - GA4
& Firebase: The Evolution of Mobile Map Measurement - Comparing
Universal Analytics to GA4: 15 Key Differences - Video:
Google Analytics 4 Fundamentals - Video:
The Four Reporting Pillars of GA4
- Roll-Up

