
GA4’s Monetization reports provide organizations with simple but actionable views into the revenue-generating aspects of their digital presence. Whether it’s e-commerce reports for retail businesses, or ad monetization reports for publishers, the Monetization reports enable businesses to gauge the profitability of various revenue streams, pinpoint lucrative user segments, and refine monetization tactics for improved outcomes. In keeping with GA4’s fundamental data model, GA4’s monetization reporting is user-centric, helping organizations optimize not just within individual sessions, but across customer lifetime.
Let’s explore all the Monetization reports in GA4.
Overview Report

The Monetization Overview provides a comprehensive overview of the total revenue generated from your website and/or app. It provides trends on how revenue (whether via e-commerce transactions or ad monetization) is trending, and helps you get a quick handle on high-level data like most popular items being purchased, commonly used coupons and promotions, and more. Like the other “Overview” reports that GA4 provides out of the box, this is handy for at-a-glance trending and quick questions, but isn’t a report you’re likely to use for deep analysis. Let’s take a look at some more detailed, actionable reports in the Monetization section.
E-commerce Purchases
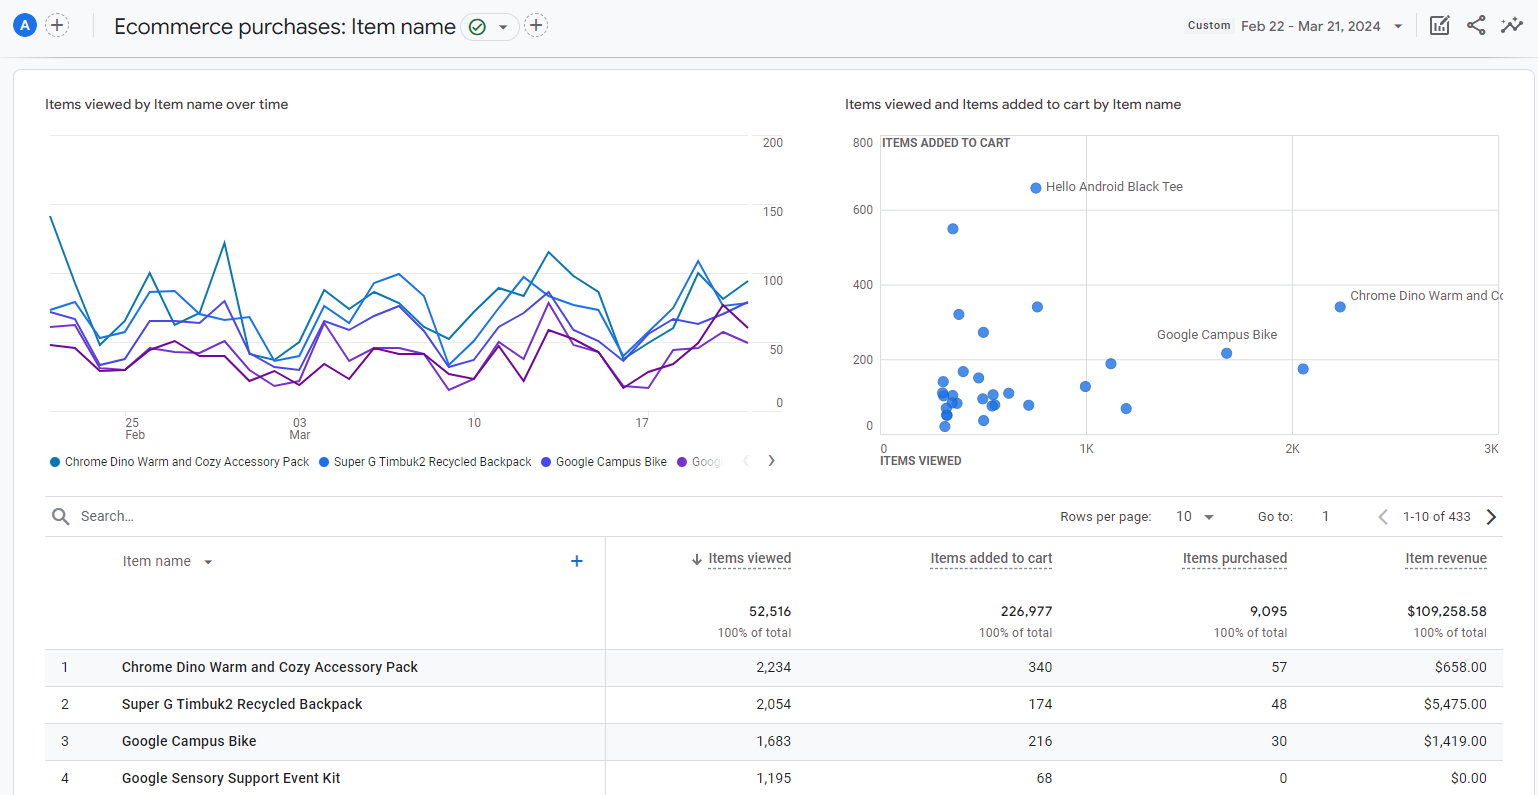
The E-commerce Purchases report offers a granular, item-by-item breakdown of which products are being purchased, as well as which products are being viewed and added to the shopping cart. Stakeholders can use this data not only to identify the most (or least) popular sellers, but also to uncover some more sophisticated insights.
For example, this report can help you understand which items are frequently viewed, but not added to the cart — or frequently added to the cart, but not purchased. Items that fit these descriptions might have a pricing issue, or some kind of “merchandising” issue. Are these items not presented in a way where it’s easy to add them to the cart? Compare these items against products that are successfully added to cart or purchased, and see how the user experience of these items may vary. From there, you should be able to develop some hypotheses for how you can optimize the performance of these items.
Purchase Journey
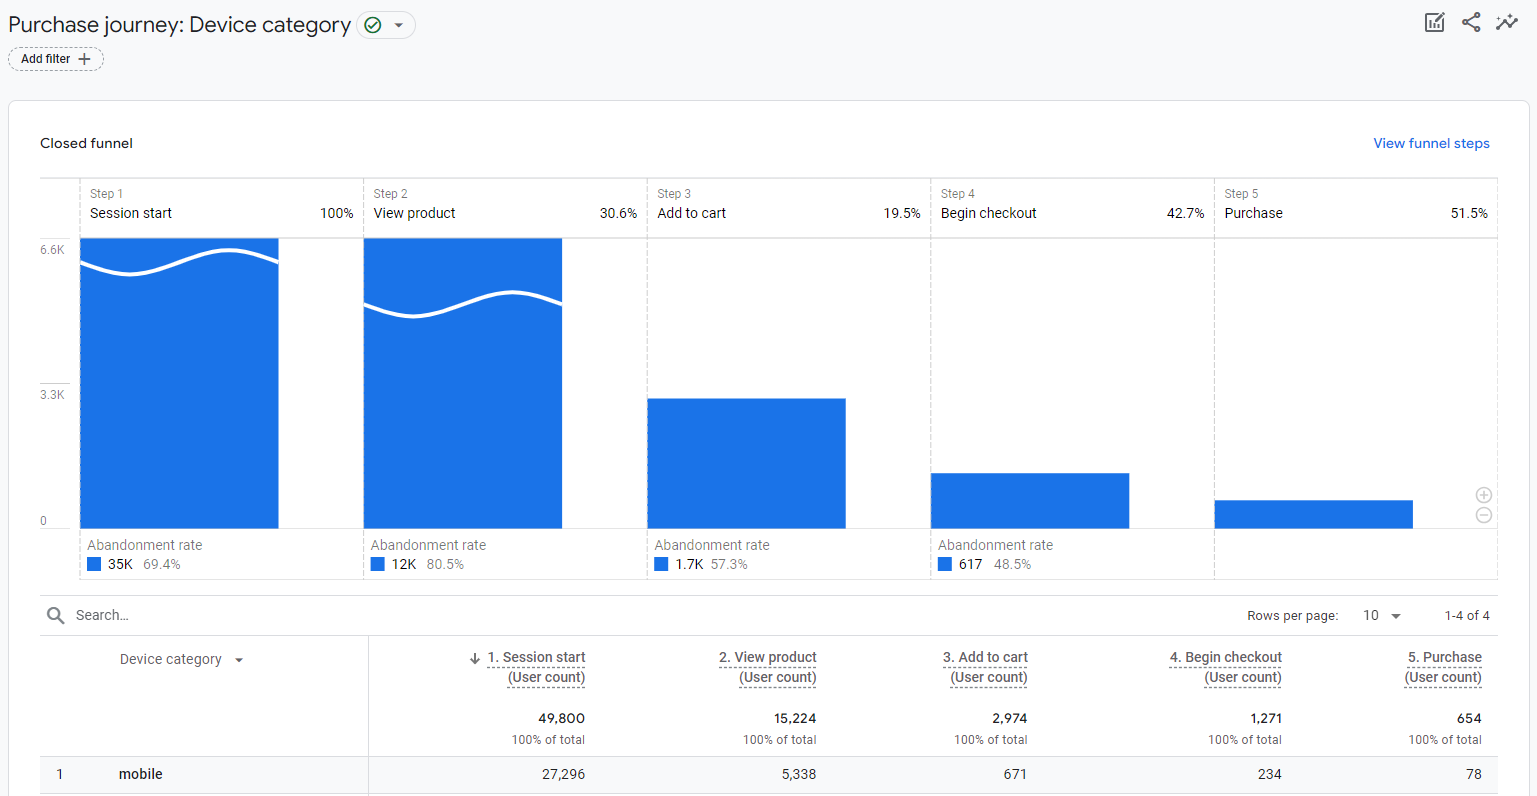
The Purchase Journey report provides a comprehensive view of the entire path that users take before making a purchase on your website or app. It tracks various stages of the purchase journey, from the beginning of a session through to purchase, providing insights into user behavior and engagement throughout the process. This report enables you to understand the effectiveness of your sales funnel and identify opportunities for optimization.
By examining user behavior at each stage, analysts can identify bottlenecks or points of friction that may be hindering conversions. For example, if you notice significant “drop-off” after the add-to-cart stage — that is, users are adding products to the cart but then not beginning the checkout process — you’ll have pinpointed an area of the purchase journey that needs some optimization.
This report can also become even more actionable when you segment the data in different ways. For example, how does the purchase journey look for mobile users, compared to desktop? For users with their browser set to Language X vs. Language Y? To analyze these kinds of questions, all you have to do is toggle the “primary dimension” of the report, as shown below.

Checkout Journey
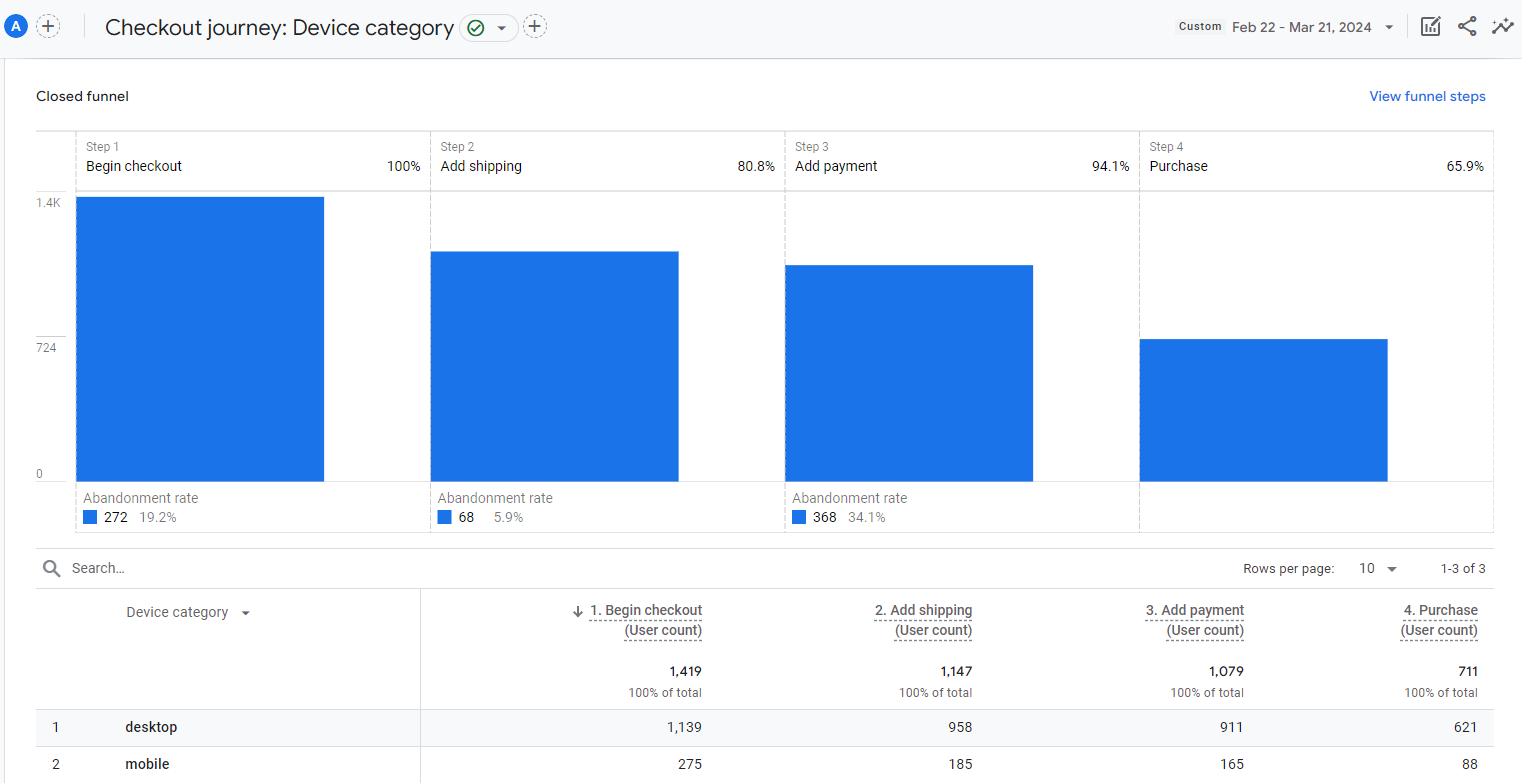
The Checkout Journey report is similar to the Purchase Journey report, but offers a more “zoomed-in” analysis of the checkout process specifically. It tracks various stages of the checkout journey, from cart initiation to order completion, providing insights into user behavior and potential points of friction. This report enables you to optimize the checkout experience to minimize drop-offs and maximize conversions.
For example, this report is helpful for understanding where exactly in the checkout process you may be losing people. Is it because adding the shipping information is a confusing process? Is it because adding payment information isn’t intuitive? Do the answers to these questions vary across user segments? Use the Checkout Journey report to get granular insights which you can use to optimize the checkout experience.
Promotions
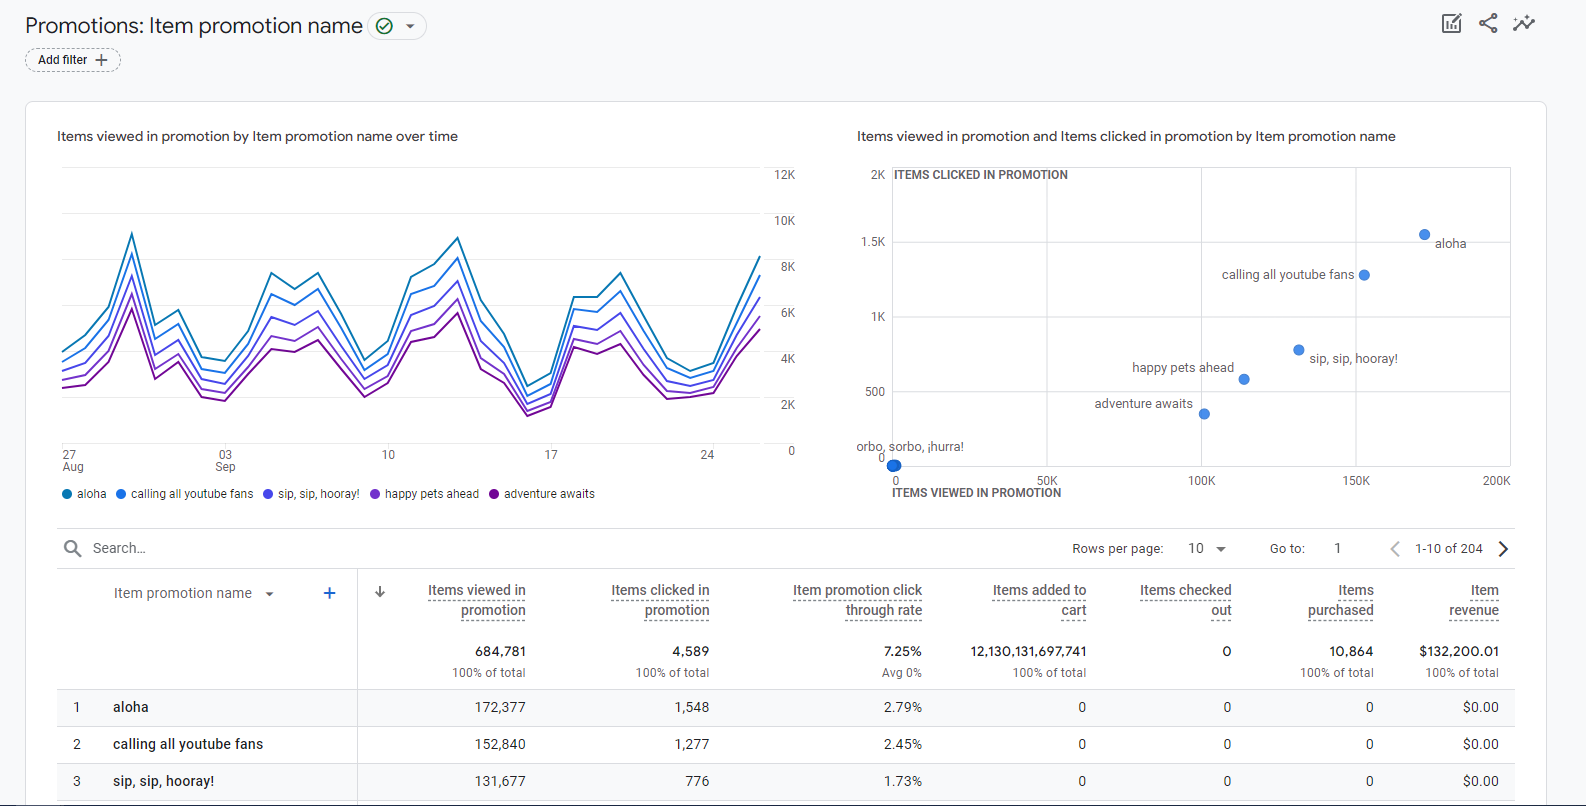
The Promotions report provides detailed data on the effectiveness of promotional activities on your website and/or app. It tracks the performance of various promotions, helping you understand which promotions draw the most views/clicks, and how those views/clicks translate into actual revenue.
This data can be very actionable when trying to optimize the effectiveness of promotions. For example, which promotions generate a lot of views, but few clicks? Or many clicks, but few purchases? Which promotions actually are tied to significant revenue? Comparing and contrasting your results can help you pinpoint strategies that are working and can be expanded upon, and strategies that aren’t having the desired impact.
As with the other reports we’ve covered here, don’t forget to segment your data to understand how patterns may vary across audiences. You may find that different promotions work well with one segment but not another, so don’t leave money on the table by making decisions with a one-size-fits-all approach.
Conclusion
GA4 makes it easy for retail businesses to understand what’s working and what isn’t, when it comes to product performance, the buyer journey, and promotions. Easily identify products with pricing or presentation issues, pinpoint friction in the checkout process, and fine-tune your promotions strategy, all with just this set of reports. We hope this overview helps you get comfortable with the Monetization reports. When you’re ready to start tackling GA4’s more powerful analysis features, check out our post on GA4’s “Explore” module.


