Understanding user engagement is vital for optimizing website or app performance and maximizing conversions. In this blog post, we provide an overview of GA4’s engagement reports, highlighting their significance and how they differ from similar reports in the previous version of GA, known as Universal Analytics (UA).
Introduction to Engagement Reports in GA4
Engagement Reports in GA4 offer valuable insights into user interactions with your website or app, helping you gauge user engagement levels and optimize your digital strategies. These reports provide a user-centric approach to tracking engagement, focusing on metrics like page views, interaction events, and more. Let’s explore each Engagement Report type in GA4.
Overview Report

The Overview report serves as a high-level summary of your website or app’s engagement performance. It offers essential metrics such as active users, sessions, and engagement rate, giving you a quick snapshot of overall engagement trends. While not overly detailed, the Overview provides a useful starting point for monitoring engagement performance and identifying areas for further analysis.
Pages and Screens Report

The Pages and Screens Report delves deep into user interactions with distinct pages or screens across your website and/or app. It furnishes detailed metrics such as pageviews, average time spent per page, and more, offering a comprehensive understanding of individual page or screen performance. This report allows you to meticulously assess how users interact with specific content, providing valuable insights into which pages or screens effectively capture user interest and which may require optimization to enhance engagement metrics.
For example, stakeholders responsible for a certain section of a website can easily filter this report to focus on just the content that falls within that section. From there, it’s easy to compare and contrast performance across pages. This means that stakeholders can quickly identify low-performing pages — perhaps that have a low average engagement time — and target them for improvement. Contrasting low-performing pages with higher-performing pages within the same section could equip a stakeholder with ideas for how to optimize the “weak spots.”
Landing Pages Report

The Landing Pages Report zooms in on the pages or screens where users first land upon entering your website or app. It offers insights into user behavior upon arrival, including metrics such as conversion rate, session duration, and average engagement time per session. This detailed view allows you to evaluate the effectiveness of landing page experiences in capturing user interest and guiding them towards desired actions.
Similar to the Pages and Screens report, the Landing Pages report helps stakeholders quickly understand how individual landing pages are performing. This is particularly important because a weak landing page — for example, a landing page with a high bounce rate — can “sabotage” the website as a whole. If a landing page isn’t successful in retaining a visitor, the chance that the visitor will convert is effectively zero (assuming they can’t convert on the landing page itself). Low-performing landing pages are excellent candidates for A/B testing with a platform such as Optimizely, which can be integrated with GA4.
Events Report
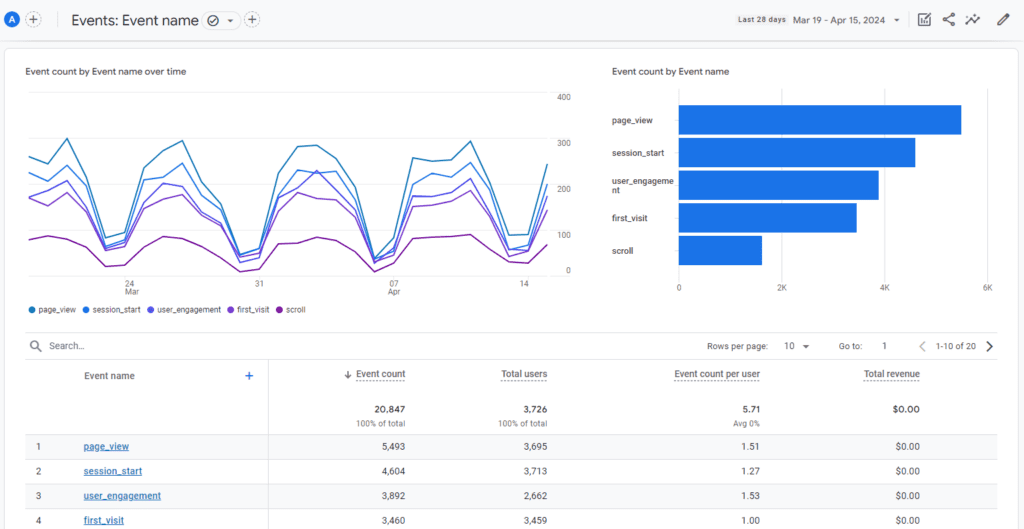
The Events Report provides insights into all events happening within your website or app. This report offers metrics such as event counts and event averages per user, allowing you to analyze where events are occurring, how often they’re happening, and more. The Events report is most useful when used as a starting point for a more detailed analysis. By default, it’s useful for high-level trending and at-a-glance reporting. When used with a secondary dimension, a filter, a comparison, etc., you can start to answer more granular questions. For example, are certain events happening on all devices? All browsers? Are certain events not happening when users arrive via particular campaigns or channels? The Events report can help you answer questions like these quickly.
Comparing GA4 and UA Engagement Reports
While GA4’s Engagement reports generally provide data that you’d have been able to get — one way or another — via Universal Analytics, there are a variety of differences worth understanding.
User-centric Measurement: GA4 takes a user-centric approach to engagement tracking, allowing for a more comprehensive understanding of user behavior across multiple touchpoints. Unlike UA, which primarily focused on session-level metrics, GA4 provides insights into user-level engagement, enabling businesses to better understand how users interact with their digital properties.
Enhanced Cross-device Tracking: GA4 offers enhanced cross-device tracking capabilities, allowing businesses to track user engagement across different devices and platforms more effectively. By combining web and app data, GA4 provides a holistic view of user interactions, enabling businesses to optimize engagement strategies for a multi-device environment.
Report Restructuring: GA4 has much less of a focus on providing pre-defined reports for data consumers than Universal Analytics. Instead, GA4 provides a small number of basic reports, and equips users with the ability to customize them to their needs, by adding/removing metrics, adjusting visuals, and more. At first glance, it can seem like GA4 has far fewer reports. The reality is that you can still do detailed analysis if you’d like, but it’s up to you to tailor the reports to your needs.
Conclusion
With the final turn-down of Universal Analytics now just a few months away, it’s time to get yourself familiar with GA4’s reports. We hope this post helps you get the lay of the land in terms of the Engagement reports. If you want to dive into some more advanced analysis tools, check out our post on GA4’s Explorations.


