 You just attended an informative digital marketing and analytics conference and you’re pumped to make it a banner year for your organization. Your analytics and marketing goals are set and now you are serious about making a difference and you want to:
- Better understand your customers
- Improve your site performance
- Squeeze every bit of ROI from your marketing initiatives, and
- Provide valuable insight/recommendations to the business
Lofty goals and they should be. But are they achievable? Yes! Supercharge your marketing by implementing the 6-step Analytics Framework outlined in this post (although, for those of us addicted to data, it seems as though we might benefit more from a 12-step program :)).
Before I dive into the framework, and for the (hopefully small) minority that is still getting familiar with analytics, it’s time to get serious about measurement or risk falling behind. Here’s why everyone should jump on the analytics bandwagon:
- Millions of sites, from start-ups to Fortune 25, use enterprise-class analytics solutions such as Google Analytics to improve their site performance.
- Today, analytics literature is abundant. Do a quick search for “web analytics” on Amazon and you’ll get over 200 results.
- Even in this day and age, it seems that only a few companies are serious about measurement and analysis. It’s time to move beyond the basics and treat data as a strategic asset. So if you’re looking for gold, it’s clear where you have to dig. Big companies like IBM can’t acquire analytics companies fast enough!
So we have established that there is more interest in data and more access to enterprise level analytics – but what is missing? We need smart people and commitment to a process. And as importantly, we need practical tips to guide us through the web of analytics. Assuming you have (or can get) smart people who care about the business and ask the right questions, here is a tried and tested framework guaranteed to take your marketing optimization to the next level.
The 6-step Analytics Framework
- Know Thy Channels
- Metrics: Less is More
- Segmentation: Give Me Context
- Intelligence at Your Service
- Reporting
- Automation
Let’s get started!!
1 – Know Thy Channels
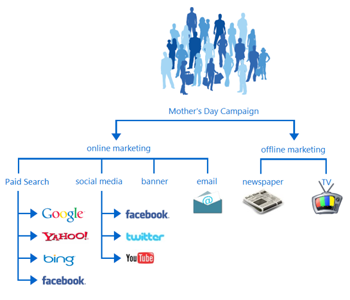
Your traffic is skyrocketing and you don’t know why. Not a good thing. You deserve more visibility. And since you’re smart and up-to-date, you know you can’t measure every channel using old metrics and by using just one tool. Hello Multiplicity! The good old pageviews won’t cut it anymore. Because channels are constantly evolving (did you know of anyone measuring “tweets” three years ago? :)), it’s crucial to understand the characteristics of each channel and identify meaningful metrics specific to that channel.
For example:
- If you are a content site, and you are busy producing videos, you want to measure the success of this digital content. Look at user behavior and events (play, pause, forward etc) and understand where and when your audience is most engaged with your content.
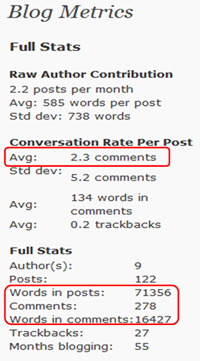
- If blogging is your forte, measure number of comments, average words per post and average words per comment. Successful blogging is comprised of an engaged audience. We use WordPress’ Blog Metrics.
- If you’re one of the millions on FaceBook, listen to the conversation through comments, ‘likes’, shares, etc. Today, conversations happen outside of your own site.
Power tip: Identify all your channels and document what engagement and outcomes you expect and want to measure.
2 – Metrics: Less is More!
Are you drowning in rivers of data? To prevent sinking, critically examine your load. Just because you have access to large amounts of data and reports in Google Analytics (and the four other tools you have on your site), you don’t need it all. When sorting through data, remember: less is more. Just focus on what keeps your CEO awake at night (or jumping for joy :)). Focus on key results, here are recommendations:
- eCommerce: report on revenue, ROAS and compare to expected outcomes
- B2B businesses: report on qualified leads and cost/lead
- Report on conversion rates and what channels are best/worst performers
- If you are just starting your analytics journey and you don’t have your analytics solution fully implemented, reporting on a “basic” yet powerful metric such as bounce rate will help you identify your worst offenders (campaigns and pages) and that’s something you can improve fairly quickly
- If you’re really advanced, develop your own custom KPIs. For example, check out how philly.com has done it. This newspaper website is measuring engagement on a new (and slightly complex) level. They are asking very thoughtful questions to help them understand their user behavior.
Power tip: Identify and trend 2-3 metrics for each of your stakeholders (business, marketing, IT, product, support)
3 – Segmentation: Give Me Context
Last month, you had one million visitors to your site. Sounds good, but is it? Not if you had three million visits two months ago. So always give your data context, segmentation is key. With Google Analytics, you can apply advanced segmentation capabilities to slice and dice your data in almost every other way you need (e.g. paid vs. non paid searches, engaged vs. non-engaged, geography, visitor type, browser, time comparison, etc. you name it). If you are the deep-dive type, you should then zoom in on your segments for more meaningful data and whatever makes sense for your business.
- If you have an eCommerce site, report on sales this month, planned sales, sales last month and sales during the same month last year
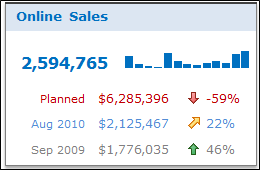
Power tip: Review your current dashboard and assess where to add an additional dimension to each report
4 – Intelligence at Your Service
Let computers do all the number crunching. Make faster, smarter decisions with reports that automatically detect and surface significant changes in your key performance indicators. It’s your site and you’re responsible for it. So log into Google Analytics, set your preferences, and let intelligence do the work. As a result, you’ll have more time to analyze and properly present your data.

Power tip: Set Google Analytics custom alerts for each of the KPIs on your dashboard
5 – Reporting
It’s the end of the month again and reports are due and you know that your site is no longer the center of the universe. You have offline data sources, campaign cost data, mobile applications, surveys etc.) So you want to blend the data for a meaningful presentation, insight and actionability. For your Analytics dashboards, bring in data from different sources and organize it under one framework.
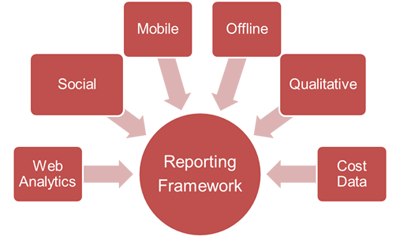
Power tip: Trend and report on those 2-3 KPIs you identified earlier
6 – Automation
Better manage your time by automating your reports. Manual reporting can take so long that we eventually neglect properly analyzing the information. Many tools are available to send data to your inbox (or dashboard). So once you have selected your key performance indicators, and to the extent possible, automate report generation. Why you might ask? Trust me, you’ll have much more time to act on the data. But, wait, there’s more!
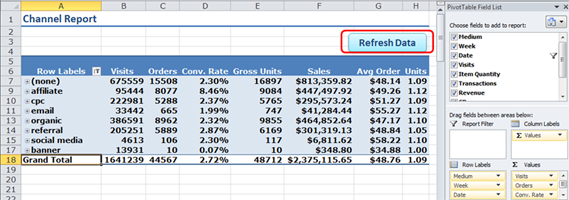
For example:
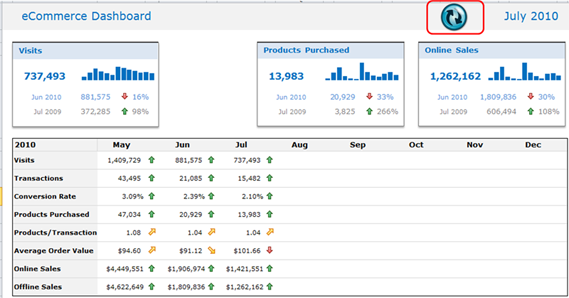
- Say you run an eCommerce site and you are using Google Analytics, find your favorite tool in the Google Analytics Application Gallery and get that data out of GA and in to your favorite application. Check out the application from our good friends at ShufflePoint who leverage the Google Analytics API to export data into Excel and Powerpoint (we simply are very impressed by what they have done and do recommend their solution to our clients). Done are the copy and paste days. Voila! One click and your data is in Excel! You can then use simple trending/charting options, advanced pivots or more elaborate dashboards as you see in these snapshots. Analyzing the data requires smart people, but getting reports should be a piece of cake. Now, spend your time wisely on important things (like reading E-Nor blog posts :)).
Concluding Notes
To summarize, marketing optimization is not a one time thing, or something that we “set and forget”. You want to “measure.. analyze… optimize” and start again. I encourage you to establish a weekly, monthly and quarterly set of activities to improve your measurement framework. The details will depend on your business and marketing activities but you definitely want to audit what you do to ensure you:
- Stay updated on new marketing channels
- Measure only what matters
- Run reports efficiently
- Dedicate time to analysis
- Upgrade your team’s Excel/reporting/analysis/presentation skill-sets
- Act on findings to positively impact the business and make sure the organization is aware of the impact!
So here it is. The 6-step framework to supercharge your marketing optimization effort! I hope you put it to use and I welcome your input, comments and feedback.
Related Posts
Author

Chief Technology Officer
View all posts
Feras Alhlou previously co-founded E-Nor in 2003 and served as President until its acquisition by Cardinal Path in 2019. Feras is passionate about his work with some of the world’s most recognized brands and public sector organizations to deliver data-driven marketing value. A recognized thought leader on the Google Marketing tech stack, he has traveled the globe educating businesses, practitioners, and consultants, and he’s also co-author of Google Analytics Breakthrough: From Zero to Business Impact. Feras received a Masters of Engineering Management degree from the University of South Florida and a Bachelor of Science degree in Electrical Engineering from the University of Tulsa. He is a Certified Web Analyst, Board Member for Red Cross Northern California, and a 3rd-degree black belt in Aikido.
