How much of your page are visitors really reading?
If you are a publisher, a media site owner, or a content manager, you probably want to know how people interact with your content. Are they reading the full article or are they just reading the headlines and bouncing? Did the intro paragraph engage them enough to read the whole article or did it turn them off? Even for eCommerce and B2B sites, you should certainly be interested in your landing page performance and how engaging your copy is. Are visitors seeing your marketing assets or are your calls-to-action not event getting noticed?
Why should I care if people are scrolling or reading my content?
Generally, if visitors are not scrolling down your pages, it’s probably a good signal that your content is of no interest to them.
If your business model relies on engaging your audience with great content, such as a publisher or a media site, you could save time and maybe money by focusing your content writers’ efforts on what is getting traction. Knowing what keeps users engaged will help you refocus your content development plan and content marketing strategy (and get rid of what doesn’t interest your audience).
If you’re selling a product and all the persuasive “sales” points (or worse, your call-to-actions or conversion buttons) are below the fold and aren’t being read, your conversion rates and bottom lines are going to hurt.
The above is also very applicable to government sites. Analytics professionals at federal agencies can leverage insights from content analysis to inform content marketing and optimization strategies for the agencies.
Let’s take the website Healthcare.gov. We’re on the “How Can I get Coverage Page” and I’ve taken a screenshot of how the page looks on my desktop browser (see below).
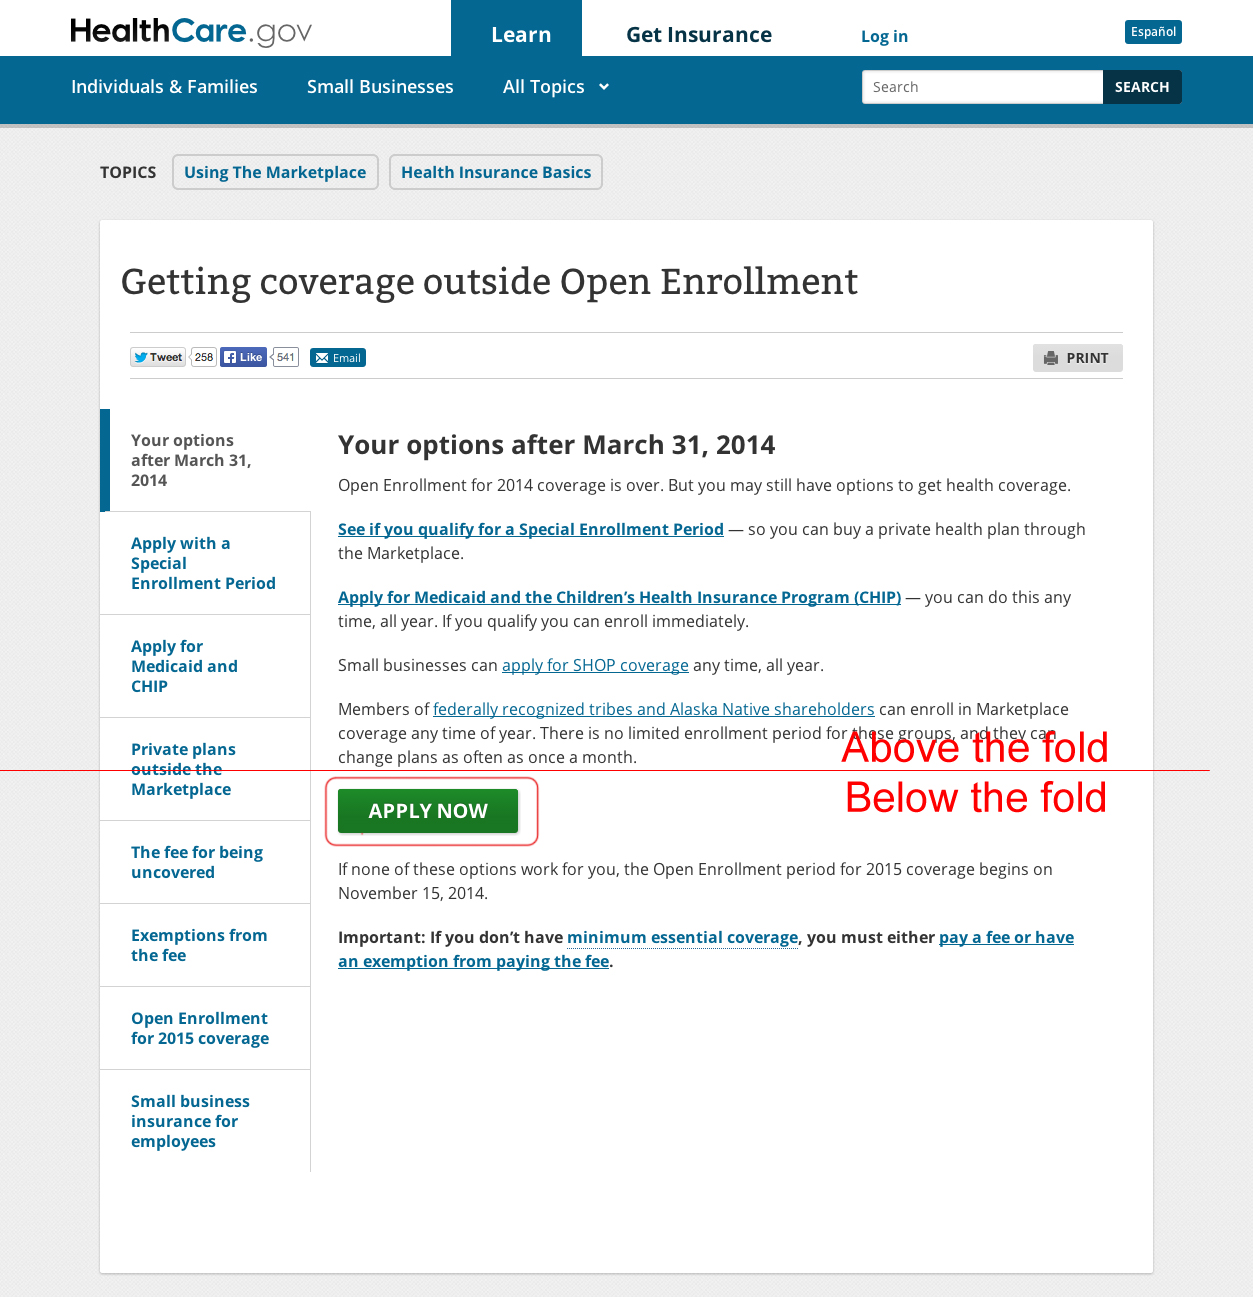
Apparently, the “Apply Now” button is below the fold, as well as some other important deadlines. Are these deadlines being read? If the “Apply Now” button is getting a low number of clicks, is it because people are seeing it and not choosing to click it or are visitors not even getting that far down the page? If we could figure out how many people get that far down and it turns out to be a low number, we could potentially optimize conversion by placing the button higher on the page.
Either way you slice it, knowing what portion of the page your visitors are reading allows you to optimize your site in a way that could lead to a better user experience and a more loyal audience.
Complementing Your Heat-mapping/Mouse tracking tools
You could always use cool heat-mapping tools like crazyegg.com, to see which areas of the page are getting the most attention and what links are being clicked. But maybe your are in a hurry and don’t have the time or the budget to acquire a new tool (and you really like to stitch the “scroll” data nicely with the rest of your Google Analytics/Google Analytics Premium reports).
- With GA, you can create advanced reports/goals/segments based on the hits provided (ex. tie the page scrolling events with a contact us goal)
- Compare page performance
- See the reports in whatever format that fits your needs, and also export them with the same Google Analytics scheme
- Trend and compare to past analysis (e.g. month-over-month page performance)
Implementing the Page Scroll Tracker using Universal Analytics
While there have been some great articles written about this already (Part 1 and Part 2 by our friend Justin Cutroni), we wanted to show this approach using Google Universal Analytics.
In Universal Analytics, there might not be a specific metric for this, but we can create “clues” that at least indicate how far a visitor has scrolled down towards the bottom of the page. We can track, for example, if a visitor has scrolled down 10%, 25%, 75%, etc, towards the bottom of the page.
The implementation process itself is easy, but you’ll need to know HTML, a little bit of JavaScript/JQuery, and of course, a good understanding of Google Analytics to read the segmented reports and slice and dice the data.
Using Javascript/JQuery, we’ve customized the code to send a Google Analytics event every 10% increment the reader scrolls down. See the code below.
Note: You can adjust the algorithm to send events based on intervals of your choice – ex. 25% or 50%.
Step #1: Make sure you’re referencing the JQuery Library.
You’ll need first to confirm whether your website already references a “JQuery” library (or not). If your website already does, you can skip this step. Otherwise add this to the header of the page.
<script src="https://ajax.googleapis.com/ajax/libs/jquery/1.7.1/jquery.min.js"></script>
Step #2: Page scroll tracking plugin code
At the bottom of ALL your website HTML pages, just before the closing of the tag, add the following code.
<script language="javascript">
//*****************************************************************
//     This script is used and customized to measure the page scroll / interaction with Google Universal Analytics.
//     Author: E-Nor Inc.
//     Created By: Mohamed Adel
//     Last Update: 04/25/2014

//*****************************************************************
/** Predefined variables **/
EventNONInteraction = false; // This variable determines the event will be a noninertact event or not
Frequency = 10; // This variable determines the Frequency the event will be fired, MAKE SURE THE NUMBER ENTERED CAN BE DIVIDED BY 100 (10 means each 10 precent the event will fire)

GA_EventCategory = 'Page Interaction'; // Google Analytics event category
GA_EventAction = 'Scroll Down'; // Google Analytics event action.

/************ DON'T EDIT BELOW THIS PART ************/
_frequency = Frequency;
_repentance = 100 / Frequency;
var _scrollMatrix = new Array();
for (ix = 0; ix < _repentance; ix++) {
    _scrollMatrix[ix] = [_frequency, 'false'];
    _frequency = Frequency + _frequency;
}
$(document).scroll(function (e) {
    for (iz = 0; iz < _scrollMatrix.length; iz++) {
        if (($(window).scrollTop() + $(window).height() >= $(document).height() * _scrollMatrix[iz][0] / 100)  && (_scrollMatrix[iz][1]== 'false')) {
            _scrollMatrix[iz][1] = 'true';
            ga('send', 'event', GA_EventCategory, GA_EventAction, _scrollMatrix[iz][0]+'%', {'nonInteraction': EventNONInteraction});
        }
    }
});
</script>
You’re done!
NOTE: If you are a Google Analytics Premium user, you’ll have a quick access to the data. If you are on GA Standard, allow a day or so and then check your Google Analytics interface for events and you’ll find an event category called “Page Interaction”. Within the event label, you’ll be able to see the percentages you set.
Through advanced reporting techniques, you can now aggregate pages based on the percentage of page scrolling!
Customizing the Code
In the code above, you’ll notice that there are 4 variables that you can customize:
- EventNONInteraction: If this variable value is set to true, the event will be set as a noninteract event in GA, and will not affect the reports in Google Analytics.
- Frequency: This variable determines the increments or intervals that will send events to Google Analytics. For example if you set the value to equal 25, this means that the Plugin will fire the Google Analytics event when reaching to 25%, 50%, 75%, and 100% of page scroll. In other words, this is the percent interval that will be tracked for scrolling, so it’s important that it’s a clean factor of 100.
- GA_EventCategory: This variable determines on what do you like to see the event category in Google Analytics. You can change the category name to your liking.
- GA_EventAction: This variable determines on what do you like to see the event action in Google Analytics. You can change the action name to your liking.
How It Will Look
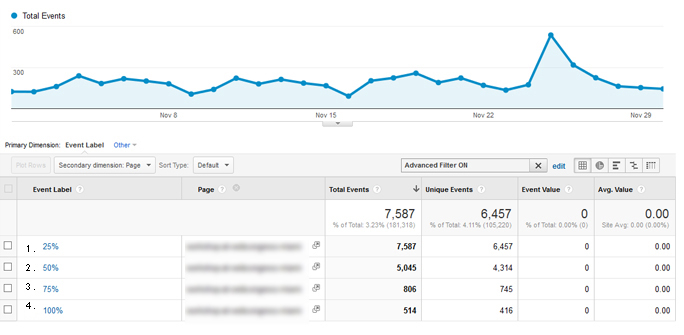
Looking at the example report above, we see the following:
- The first 25% of the page has been shown 7,587 times
- There are 5,045 users have scrolled to the middle of the page (50% Scrolling percentage)
- There are 806 users have scrolled to the third quarter of the page (75% Scrolling percentage)
- There are only 514 users who have scrolled to the end of the page (100% scrolling percentage)
Let’s pretend this is the Healthcare.gov example from above. While you would have thought the FULL page was viewed 7,587 times, it seems only 60% are scrolling halfway down the page, only 7% of these visits scrolled to the bottom of the page. Since the “Apply Now” button is below the half way mark, that means only 60% of those visitors even saw it. Placing it to the top may increase task completion rates.
If your great content, calls to action or product/service benefits are located at the bottom of your pages, it’s time to re-think your page layout/content structure and improve your user engagement. You can (and should) dig a bit deeper and segment each of your channels and assets to see which campaigns bringing engaged users and which campaigns are bringing you bouncers!
Next Article: Measuring Responsive Scrolling
What happens when your design actually looks different on different devices? Your conversion button may be below the 50% mark on your desktop but not on your mobile! Stay tuned for the sequel to this post!
Happy Analyzing!
Would love to hear your thoughts and comments below.


