If there are lies, damned lies and statistics, bad data visualizations are the viral means of spreading these lies. Data visualization is the new storytelling. While bad stories may lead to bad memories, bad visualizations of your business data can lead to wrong conclusions that can hamper or – even worse – tank your business. There is no dearth of bad data visualizations; you can find them everywhere from news websites, to journal articles, to infographics. However making better visualizations that convey the story that you intend to communicate is straightforward once you know a few simple tips.
Provide Content
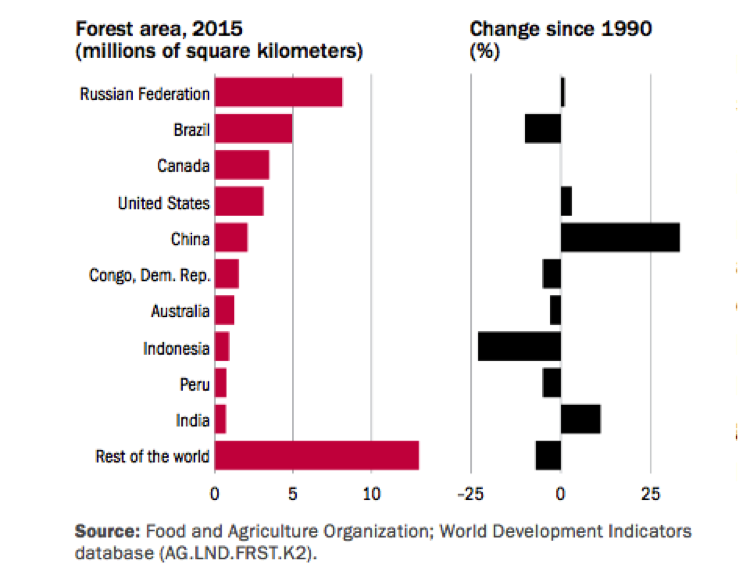
One of the main purposes of Data Visualization is storytelling, to lead the reader to understand the what along with the why visually. Insights cannot be drawn in a vacuum or by slapping a few charts together. Engage the reader and show them why they should pay attention or take action.The deforestation data in this chart could be enhanced by outlining the contributing factors within the visual itself to provide more context. [Source]
Use the right charts
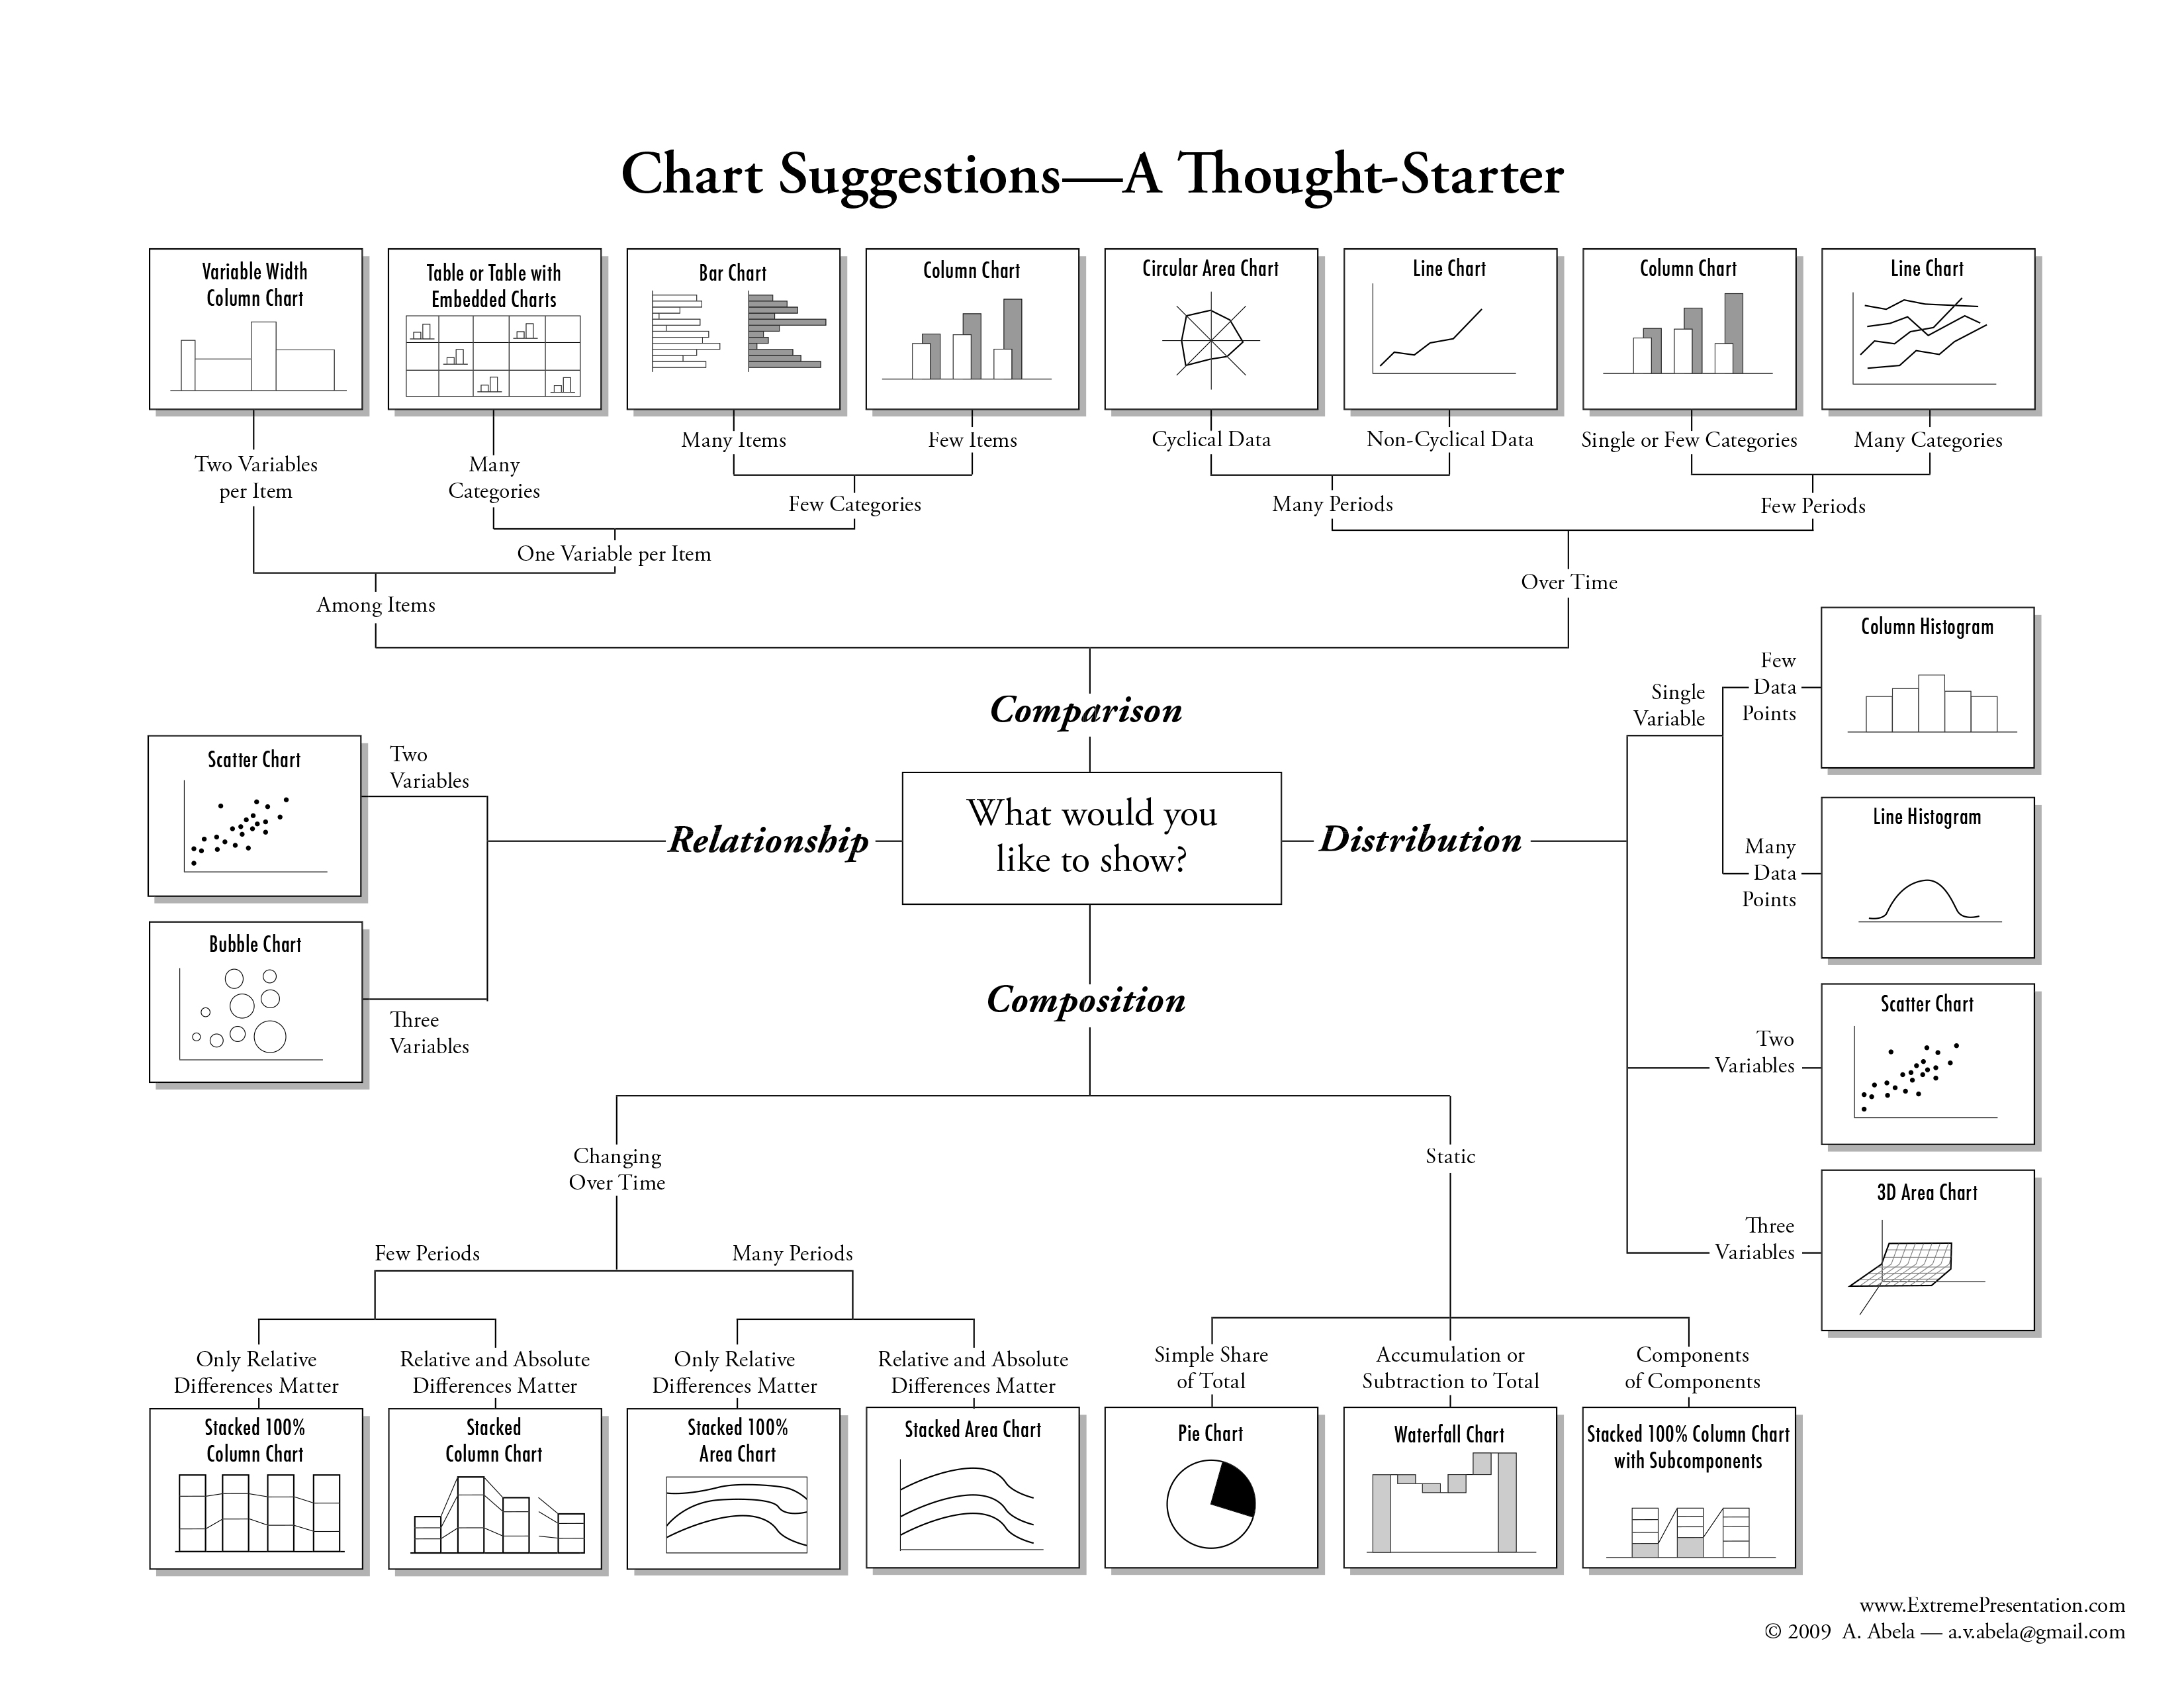
There may be more than one way to visualize your data, but what chart you choose will depend on your data, the audience and the purpose of the visualization. While your data visualization tool will likely provide recommendations on the appropriate chart type, here are some guidelines that you can follow.
Visualization Purpose
Description
Recommended Chart Type
Comparisons
You are trying to compare different values in your data set for e.g. which channel brought you the most traffic?
Bar Chart, Column Chart, Line Chart
Trends
You are trying to plot the trends in your data set for e.g. has our summer campaign increased sales in the last six months
Line Chart, Column Chart
Correlations
You are trying to map relationships between variables e.g. Ad spend and number of visits
Scatter Plot
Part-to-Whole
You need to show the device breakdown of your site visitors. Think Pie Chart
Pie Chart
Use the table above to match your visualization purpose with the correct chart type. For a more in-depth understanding and to explore the alternative chart types refer to these resources.
“Perfection is Achieved Not When There Is Nothing More to Add, But When There Is Nothing Left to Take Away” – Antoine de Saint-Exupery Nowhere is this quote more appropriate than in data visualization. Keep your visualizations simple and clean without dumbing down the insights. Remove anything and everything that is not adding value to the reader e.g. grid lines, shadows, text etc.Note – In the above visual the author wanted to highlight the data for bacon so the bar for bacon was intentionally left red. [Source: Darkhorse Analytics]
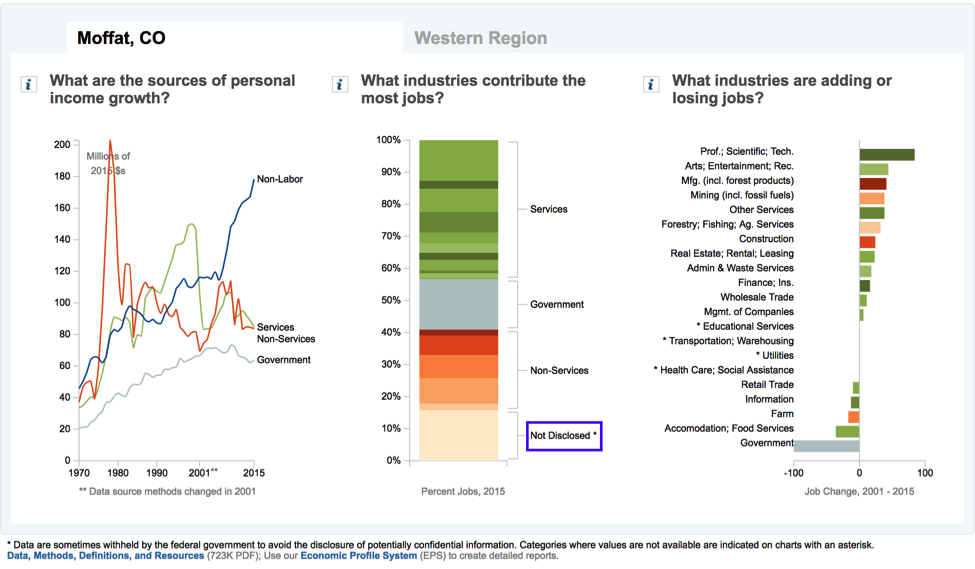
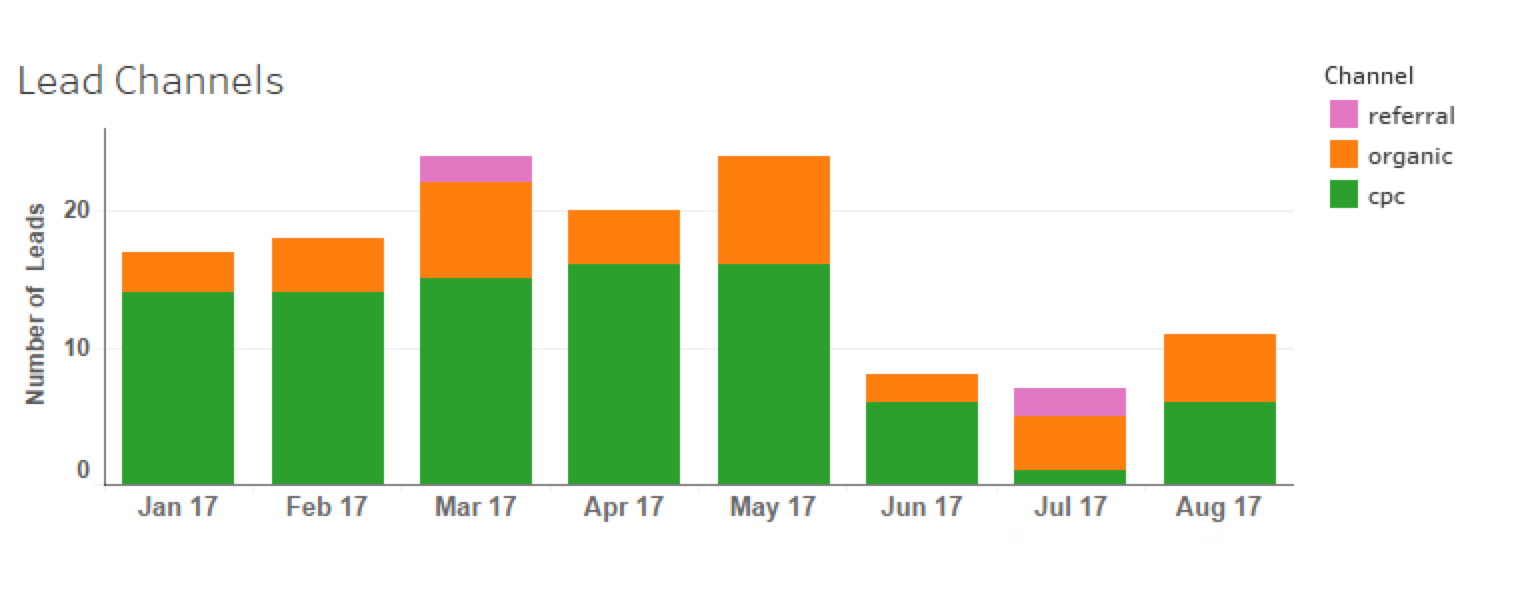
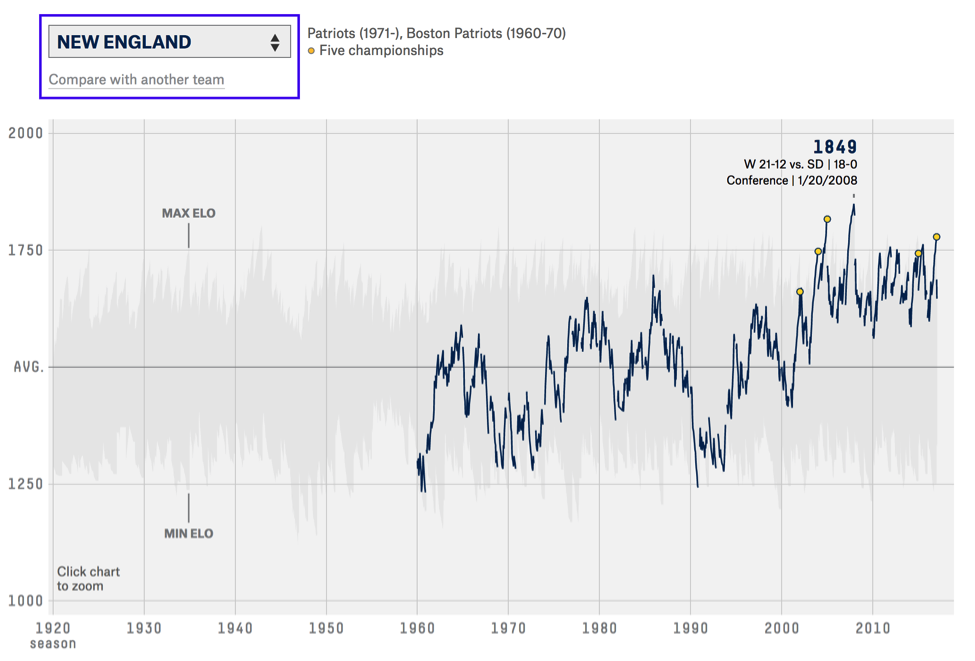
Visualize Missing Data
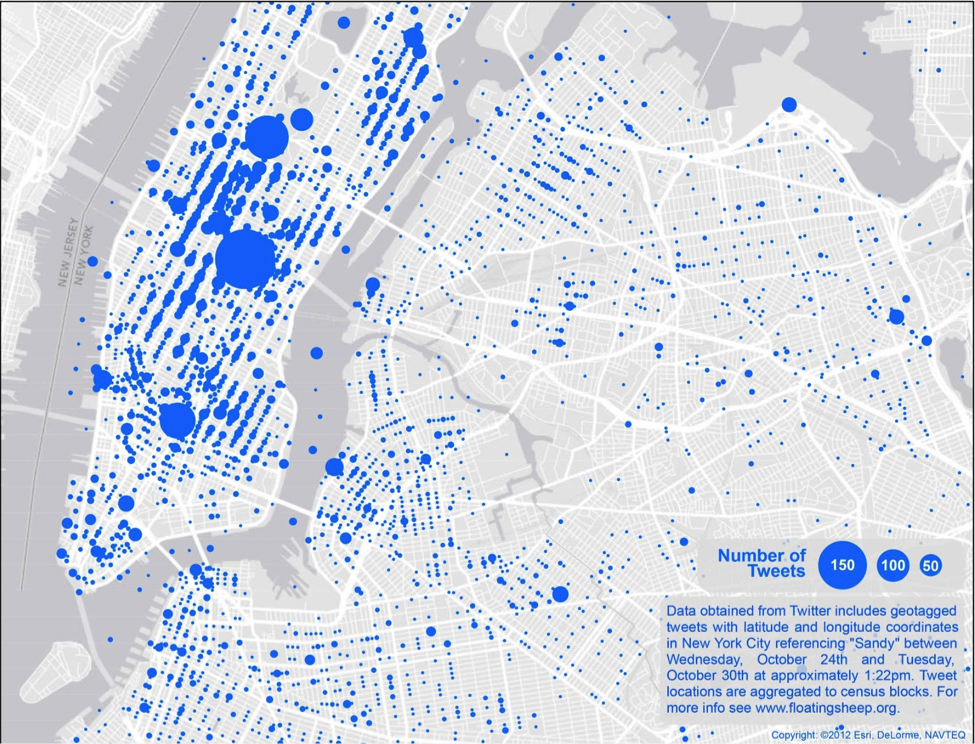
The absence of data is a powerful story by itself, do not ignore the nulls and skip time intervals because there is no data to visualize. Rather ask Why was the data missing? and provide an answer. Did your website experience a hosting outage or did you apply a filter in Google Analytics to include internal traffic instead of exclude. Instead of ignoring missing data, label the data appropriately, add a note and find a way to visualize it.The author here not only represents the missing data but also provides a reason via a chart footnote. [Source]Data may be missing for multiple reasons: poor data collection, data entry errors, limited accessibility to a given population or legal or privacy issues preventing disclosure of information. However what are the implications of missing data, what can we infer from it? Andy Kirk in a presentation called ‘The Design of Nothing: Null, Zero, Blank’ explains how the Red Cross used missing tweet data to dispatch help in New York city during Hurricane Sandy. ‘A social media blackhole meant the area needed help’.Always look for the interesting stores behind missing data. [Source]If you need inspiration on how to encode the 0’s and nulls in different types of charts check out this video from Andy Kirk.
Reduce Cognitive Overload
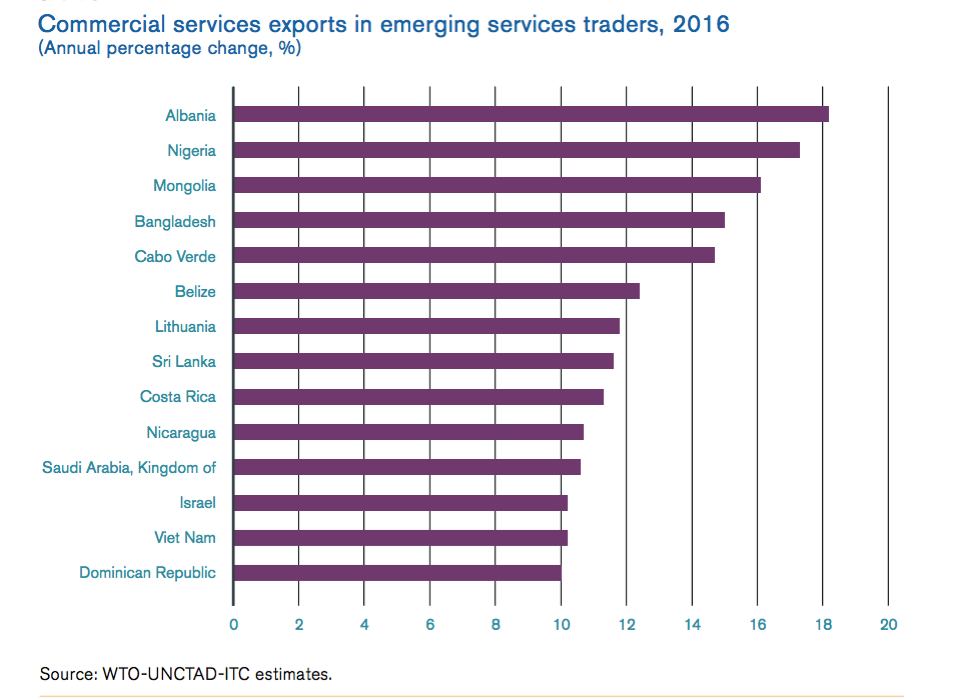
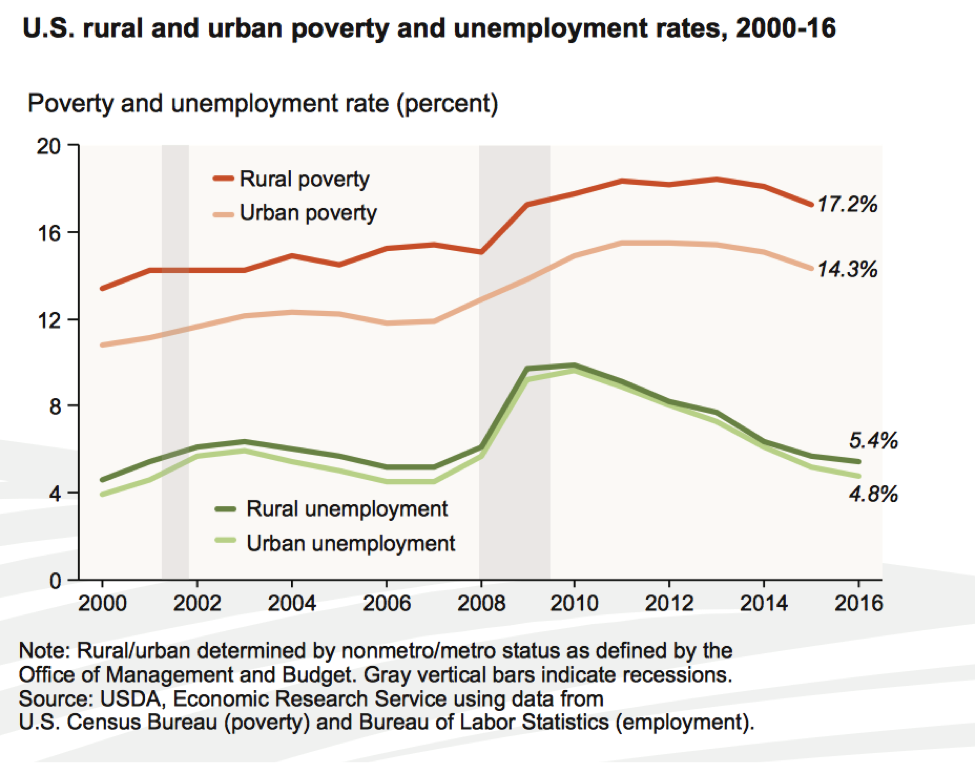
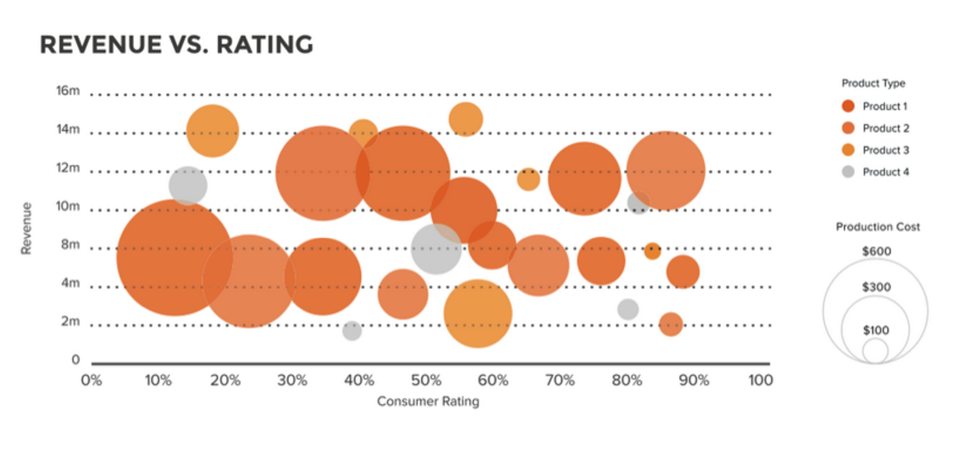
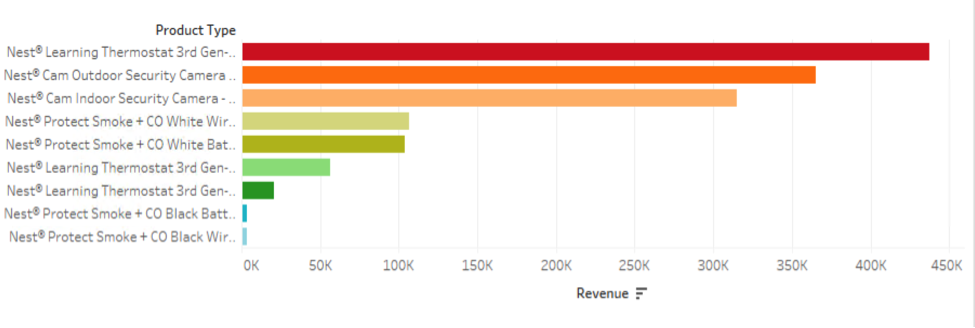
Any visualization should not only clarify but also allow the reader to retain the information presented. Retention happens when the charts don’t have a high cognitive overload. Some of the ways to reduce cognitive overload are Sort your Data Make comparisons easier by sorting the data from the lowest to the highest values if they are numbers, and alphabetically if they are categories.Sorting the data makes it easier to compare the values. [Source]Do the Calculations Do the math and don’t put the reader to work e.g. don’t make them calculate the bounce rate or the conversion rate.Calculate the Bounce Rate for your user. Don’t make them do mental math.Identify the Relationships Don’t keep the audience guessing about what variables you are trying to correlate include the relationship in the title and if possible the result in a subtext.The x and y variables are identified in the title itself allowing you to focus on the trended data. [Source]Accurate Scaling Represent the data accurately in proportion to the scale. The size of the chart or symbol should be proportional to the data point being represented.The bubbles in a bubble chart should be sized based on area. [Source]
Color your Data Viz
Color plays an important role in a data viz by guiding the reader to grasp the data relationships (quantitative or categorical) instantly in a visualization. Maureen Stone, a color expert and research manager at the data visualization company Tableau provides some tips on identifying the type of function color is serving. What are you using the color for?
Is it being used to discriminate between categories?
Or is it assigning value along a scale, using different shades of the same color to indicate more or less of something?
Perhaps its only function is to serve as an unassuming background color against which color-coded categories can “pop.”
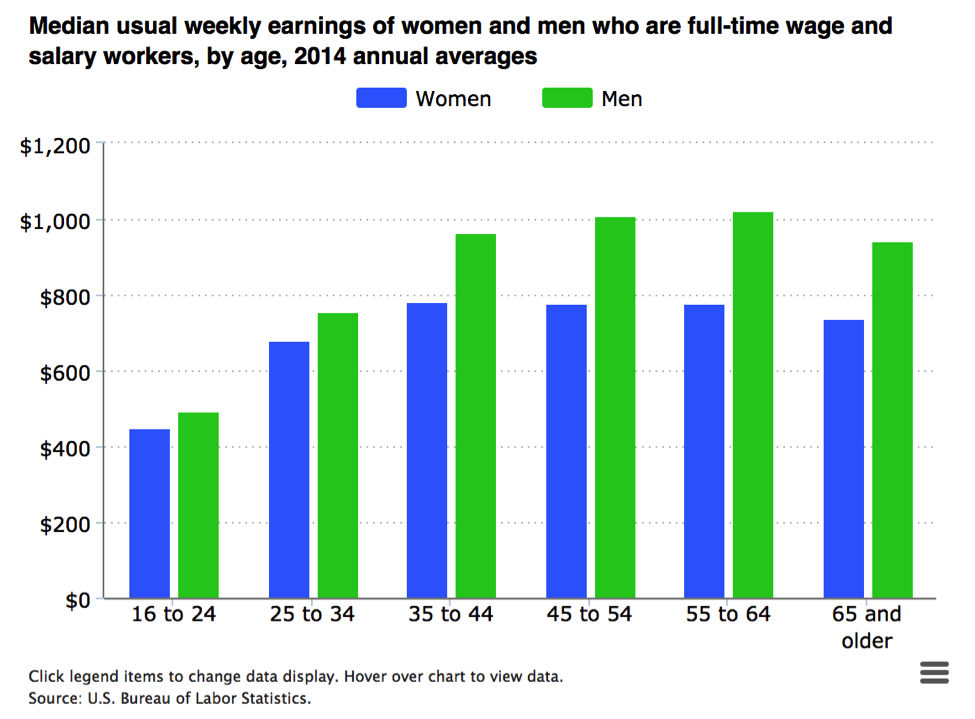
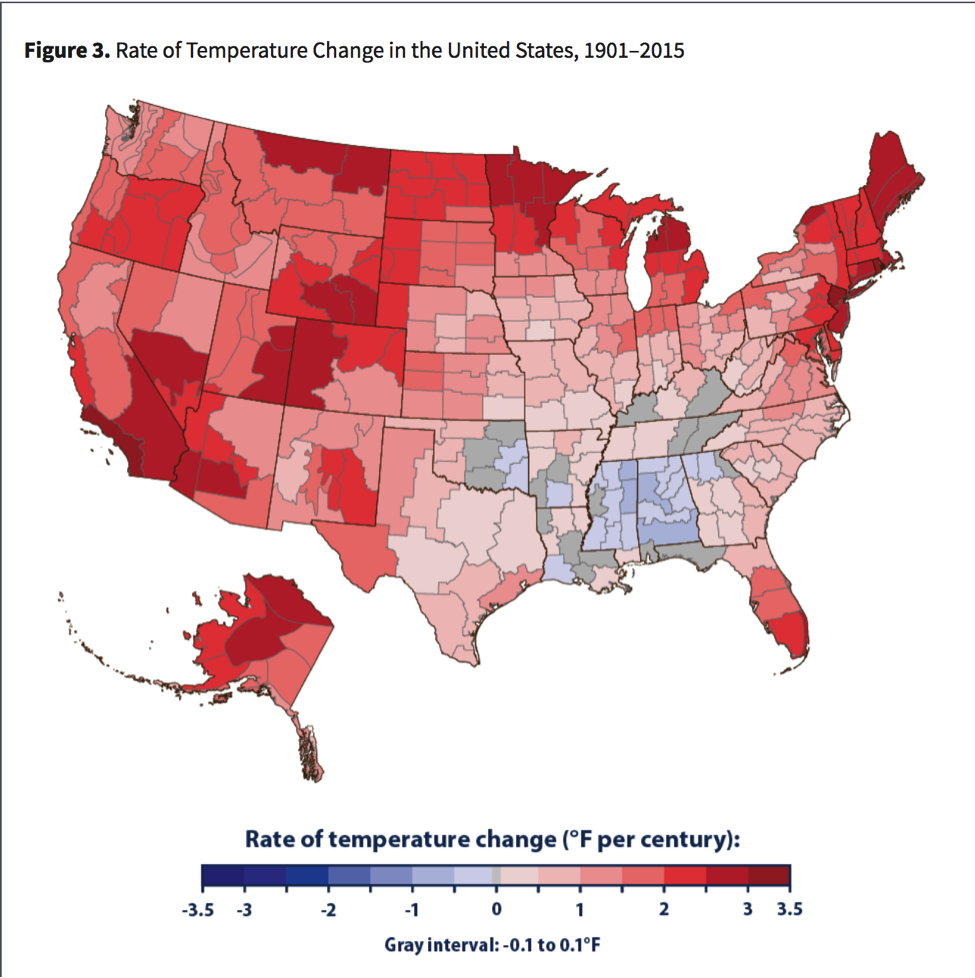
Some recommendations when picking colors – Contrast Colors Use contrasting or complementary colors for categorical data (gender, region) to compare and highlight the differences.Use of contrast colors helps in highlighting the disparities easily. [Source]Analogous Colors Use analogous colors while grouping related data like product typeUsing analogous colors to group related categories will help in easy identification.Color Gradient Use a gradient from the same color palette to denote degree of progression (ratings, temperature)Using the same color palette will help in highlighting the extremes easily. [Source]Color Consistency Be consistent across your visualizations e.g. use the same color to represent your source/medium data across all your charts. Using the same colors across multiple charts helps maintain consistency.
Labelling
Below are some specific tips for labels, the little clues you provide readers to interpret the chart correctly:
Label the axis correctly and consistently across all your charts.
Avoid using acronyms that are not widely understood.
Make the chart title as concise and descriptive as possible.
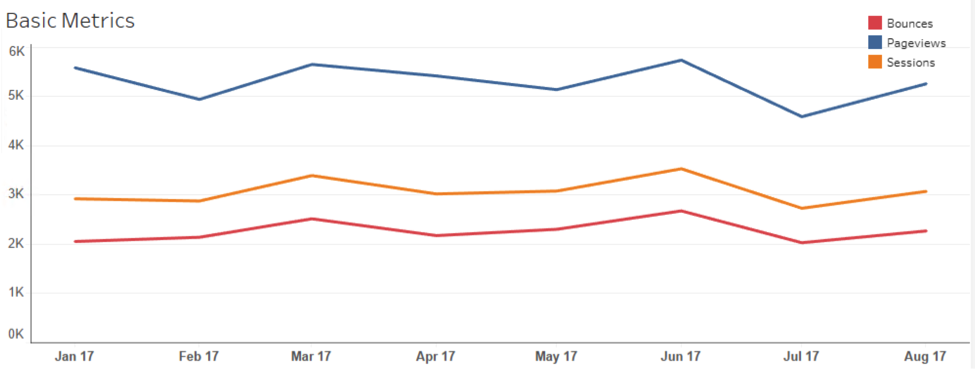
Whenever possible, label the lines in your line chart directly rather than using a legend.
Use tool tips rather than labels wherever appropriate to annotate specific data points.
Be consistent in formatting; if you are working with currency symbols, percentage signs and the decimal values, retain them across all your charts.
Using direct labeling is helpful in keeping the reader’s attention focussed on the visual than using a legend. [Source]
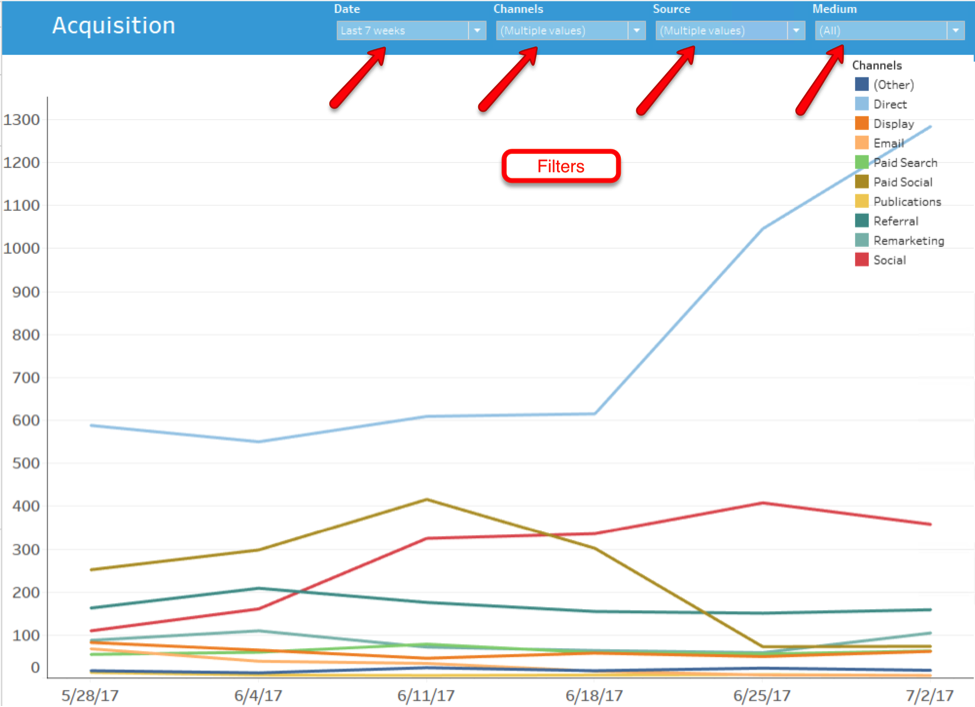
Empower the user
Instead of bombarding viewers with more information, nudge them to find and focus on insights that are relevant to them. Make the visualization interactive and flexible. Are your readers looking for insights based on time period, region or product type? let them decide what they want to see and use filters and selectors to accomplish the same.[Source]Put the data in their hands: give them the power to sort, filter, drill down and toggle to find interesting patterns in their data and be vowed. Another benefit of providing such a customized visual experience means you don’t have to go overboard and include every small detail on your dashboard. Below is another example of how you can analyze your google analytics data using several filter options like Date, Channels, Source and Medium.Use filters to slice and dice the data to obtain granular insights.
No unfair comparisons
When comparing across different time periods (YoY or MoM or WoW) always be aware of the time shift. You would not want to compare five sundays with four sundays so make sure the day of the week is aligned, this is even more relevant if your data is from a seasonal business. Another commonly overlooked factor when drawing comparisons is ignoring that your data set has changed. For example say you are comparing the performance of your affiliate marketing from last year to this year but forget that some people dropped out as affiliates early this year showing a drop in revenue. Here are some common don’ts
Avoid animations and 3D charts.
No pie charts if you need to visualize more than two or three categories of data.
Use area charts sparingly, they can be visually distorting.
Your charts should have no more than six colors.
No matter what data set you encounter you will always be faced with multiple ways to visualize your data. However by keeping a few of the above recommendations in mind you can create useful visualizations that can both clarify and contextualize your communication. When designing your data visualizations always keep your audience in mind; when in doubt remember ‘less is always more’ and don’t ever use design for decoration. If you are interested in learning how to create powerful data visualizations using Data Studio or just want to learn more about Data Studio then please sign up for our online or custom reporting and dashboard courses.
Your one-stop-shop for everything Google Marketing Platform, designed to help marketers stay informed and up-to-date on product news, solutions, how-to’s, and more.
You should receive a confirmation email from GoToWebinar with your unique webinar login information. If you do not receive this email or have trouble logging in to the event, please email asmaa.mourad@cardinalpath.com.
Thank you for subscribing!
You're now looped into the world's largest GMP resource hub!


 Using the same colors across multiple charts helps maintain consistency.
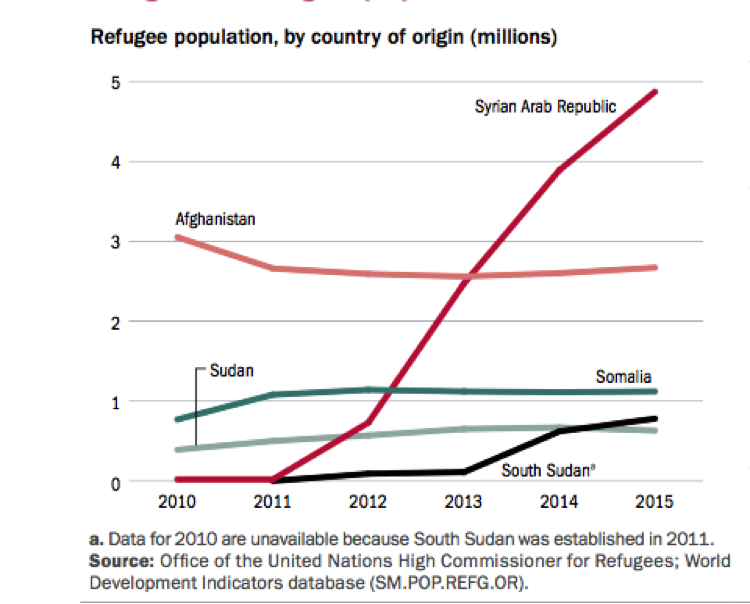


