
Part 2: Measuring the Checkout Process
Once you’ve gotten a shopper to add a product to their shopping cart, you’ve got a “fish on the hook.” Now it’s time to reel that fish in … but in e-commerce as in actual fishing, there are a lot of ways for your “big fish” to get away. The journey from adding products to the shopping cart to successfully completing a purchase is fraught with potential drop-off points. Understanding shopper behavior and experiences during this crucial phase is vital for e-commerce professionals. This blog post picks up from where we left off, diving into the key engagement metrics and strategies for tracking and optimizing the checkout process. Enabling these events and metrics will help you use GA4’s advanced analytical capabilities to optimize the performance of your checkout flow.
Key Engagement Metrics to Track
1. Checkout Abandonment Rate
Let’s start with the most obvious checkout “health” metric. The Checkout Abandonment Rate metric measures the percentage of sessions which initiate the checkout process but end without a completed purchase. It’s a crucial metric for identifying the stage(s) at which potential customers decide to leave, providing essential insights into optimizing the checkout flow to enhance conversion rates.
Scenario: In the midst of a promotional event, you observe that a significant number of users start the checkout process but do not finalize their purchases. This pattern might reveal challenges such as unexpected additional costs (such as shipping fees or taxes), a complex or lengthy checkout process, or a reconsideration of purchase decisions. By closely examining these moments of checkout abandonment, effective strategies can be developed to mitigate these issues. This could involve simplifying the checkout experience, ensuring transparency regarding all costs early in the shopping process, or providing clearer information on delivery times and return policies.
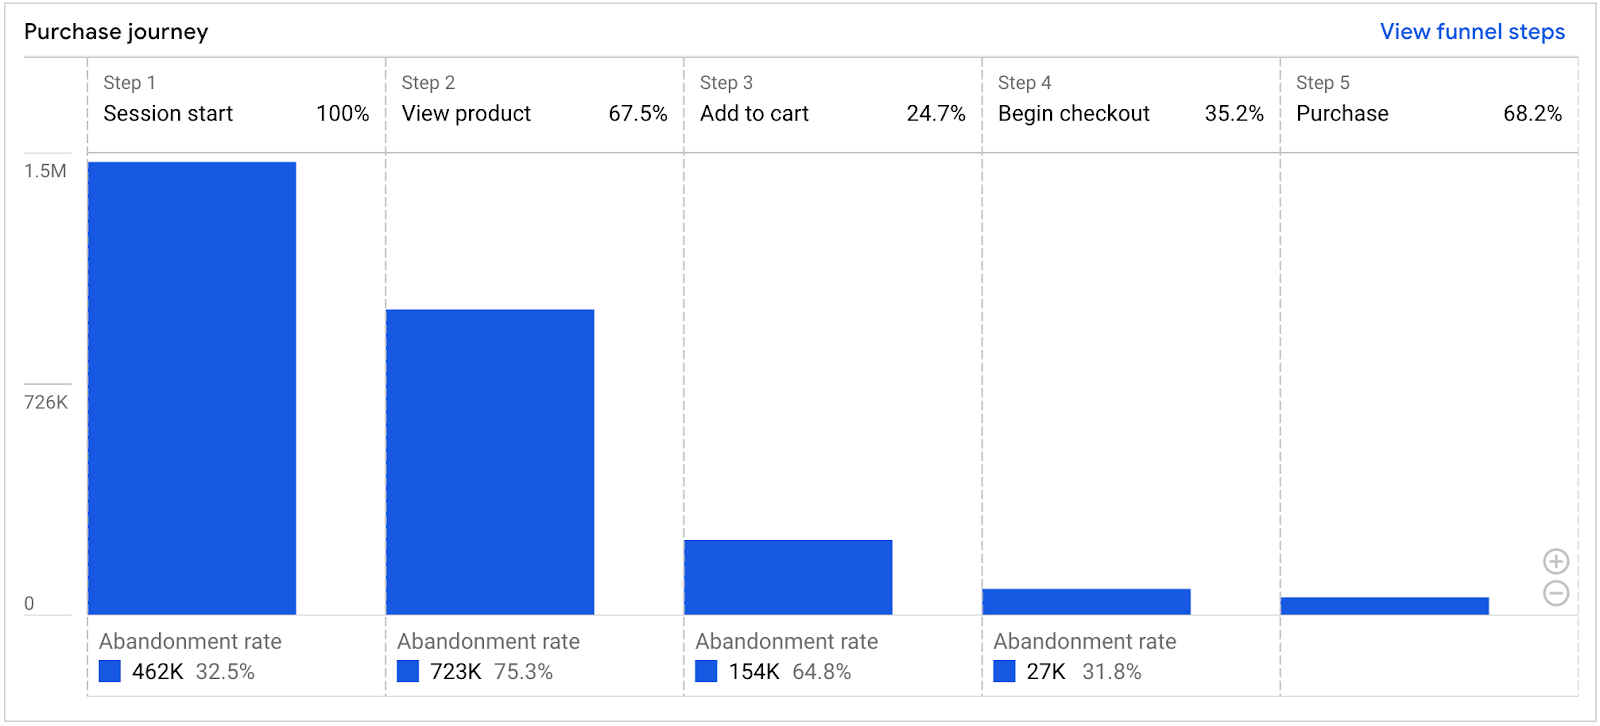
Aggregate View: The Purchase Journey report shows how many users drop off between each step in your purchase funnel.
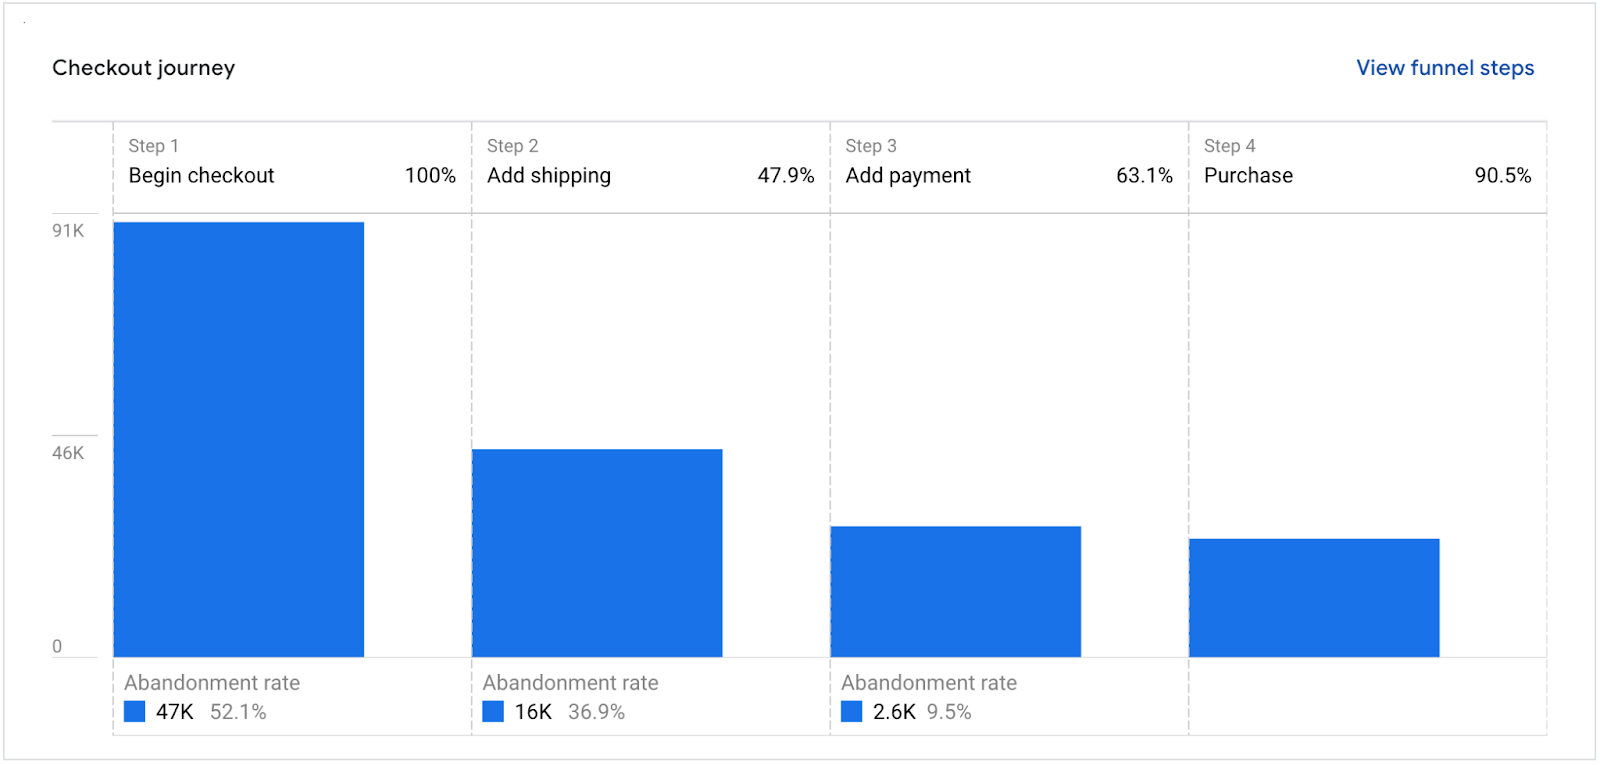
Detailed View: The Checkout Journey report shows the number and percentage of users who began checkout on your ecommerce website or app and completed each of the subsequent steps in the checkout funnel.
How to track in GA4:
Utilize the begin_checkout, add_shipping_info, add_payment_info, and purchase events to calculate the abandonment rate and to monitor the leaky shopping cart phenomenon.
- begin_checkout: This event signifies that a user has begun a checkout.
- add_shipping_info: This event signifies a user has submitted their shipping information in an ecommerce checkout process.
- add_payment_info: This event signifies a user has submitted their payment information in an ecommerce checkout process.
2. Remove from Cart
Tracking “Remove from Cart” actions can highlight potential hesitations or issues that lead customers to reconsider their choices before finalizing a purchase.
Scenario: A user adds several items to their cart during a promotional event but decides to remove some of them upon reviewing their total cost at checkout. This behavior can indicate sensitivity to total price, the influence of shipping costs, or a change in purchase intent due to the final cart summary. Monitoring these removal actions provides insights into user priorities and can inform strategies to reduce cart abandonment.
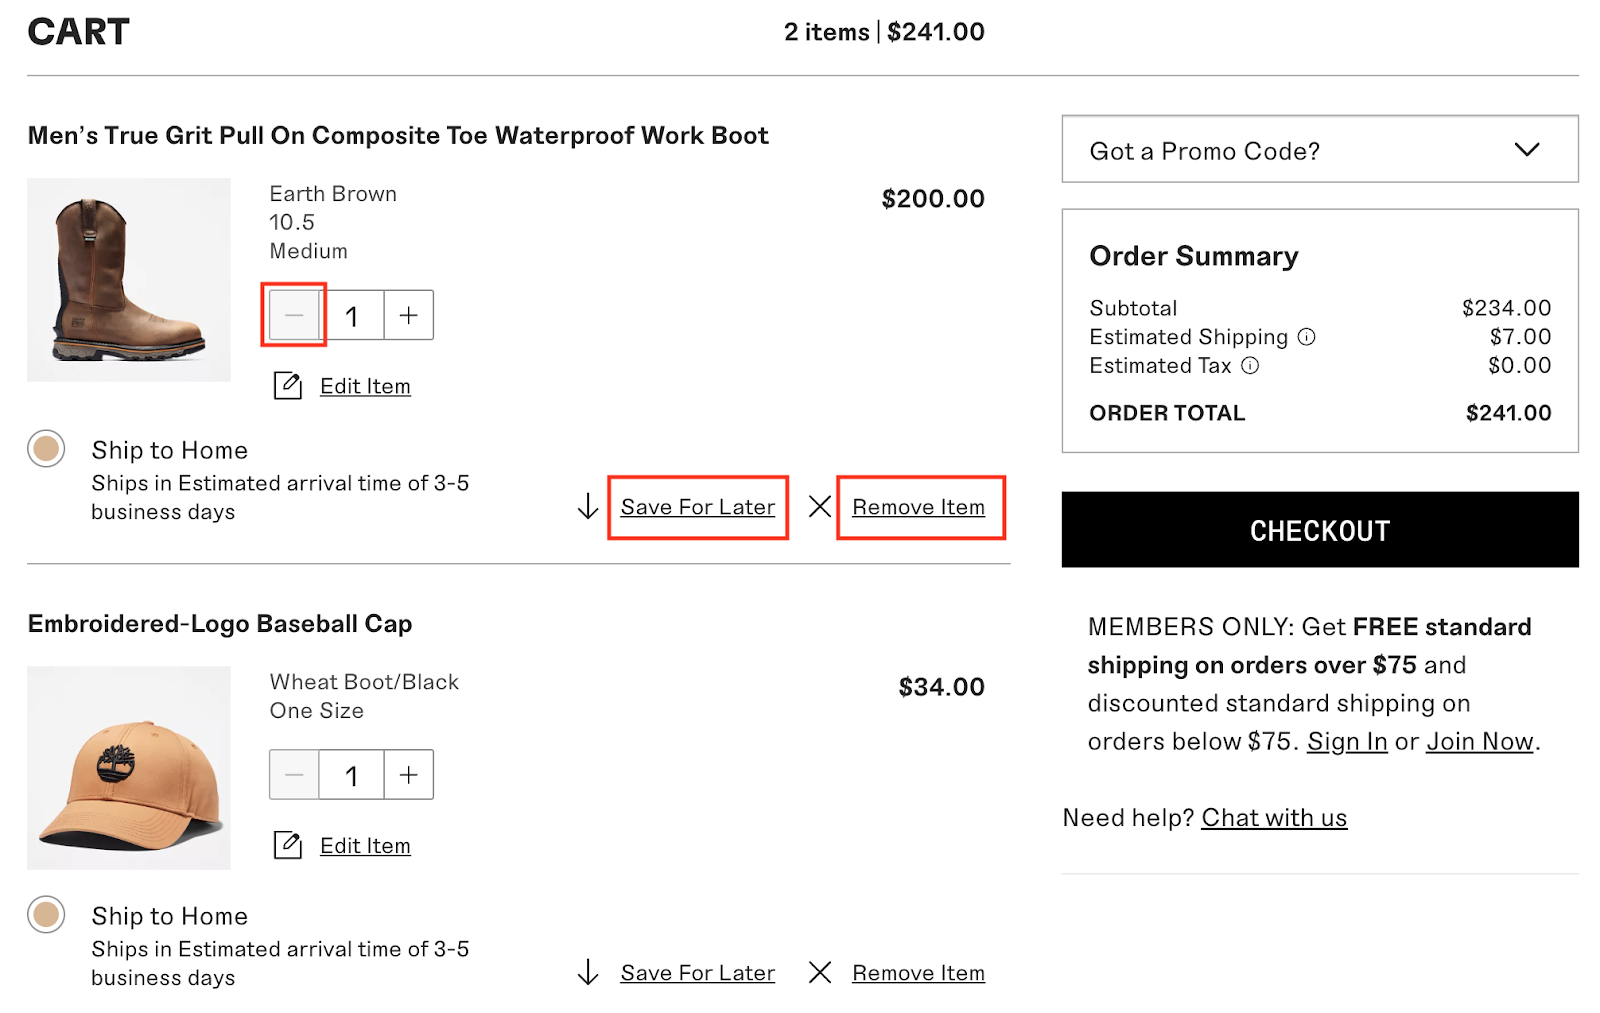
Shopping cart images throughout this post courtesy of Timberland, and used for illustrative purposes only. Timberland is not affiliated with Merkle | Cardinal Path in any way.
How to track in GA4:
Utilize the remove_from_cart event.
Parameters: item_id, item_name, price, quantity (being removed), and reason (optional parameter to capture why the item was removed, if known, e.g., user input or an offered survey).
Cart Abandonment Value
Cart Abandonment Value, whatever you end up calling it, is essentially “money left on the table.” This metric quantifies revenue lost due to abandoned carts, i.e. the value of items left in a cart without being purchased. This metric helps e-commerce businesses understand the financial impact of not converting interested shoppers into paying customers.
Scenario: During a major sale event, several users add items to their carts but exit the website without completing their purchases. By analyzing these abandoned carts, you can estimate the total value of products that were close to being sold but ultimately weren’t. This insight allows you to identify patterns or commonalities in abandoned carts, such as specific products that frequently go unpurchased or times when abandonment rates spike, providing opportunities to address underlying issues and recover potential sales.
How to track in GA4:
Create a Calculated Metric called “Cart Abandonment Value” or something similar. Your formula should be: “Value of Items Added to Cart” – “Revenue.”
- Value of Items Added to Cart: This can be tracked using the add_to_cart event, where you capture the value parameter for each item added to the cart.
- Revenue: The total value of the completed transaction.
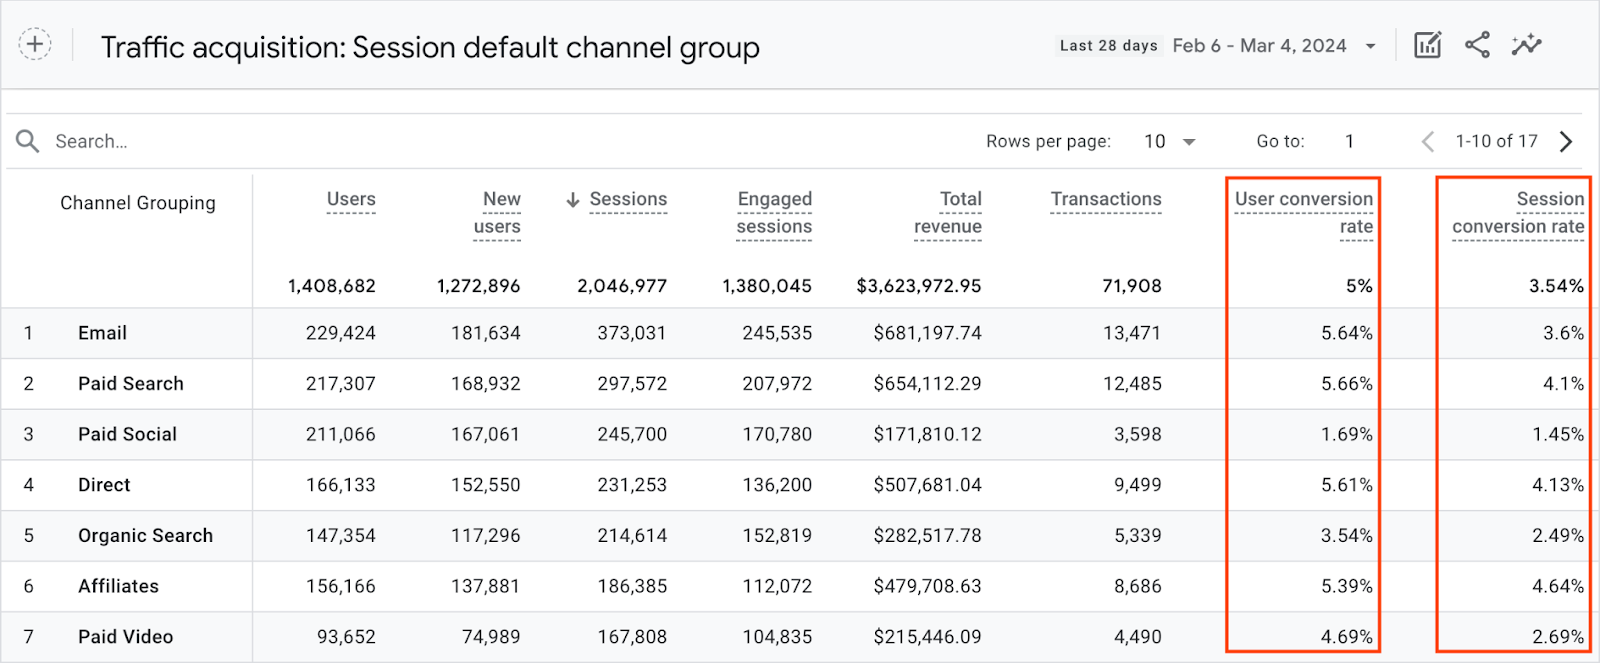
Conversion Rate
The Conversion Rate is the most basic yet important engagement metric for e-commerce sites, measuring the percentage of visitors who take a desired action out of the total number of visitors. It’s a key indicator of your site’s effectiveness in converting browsing into valuable outcomes.
Scenario: After launching a targeted marketing campaign, you notice a significant rise in purchases. This surge in successful transactions, compared to the total number of site visitors attracted by the campaign, marks a noticeable improvement in the conversion rate. This uptick signifies that the marketing campaign effectively resonated with the audience, compellingly guiding them from initial awareness to making a purchase.
The Conversions report is a pre-made report that shows how often users triggered each conversion event.
How to track in GA4:
Leverage the purchase event to track conversions. Note: the Conversion Rate metric treats all transactions as equal in value. Thus, an increase in conversion rate could potentially reflect a higher volume of transactions with lower average order values (see below), possibly due to an increase in purchases of lower-priced products.
Conversion Duration
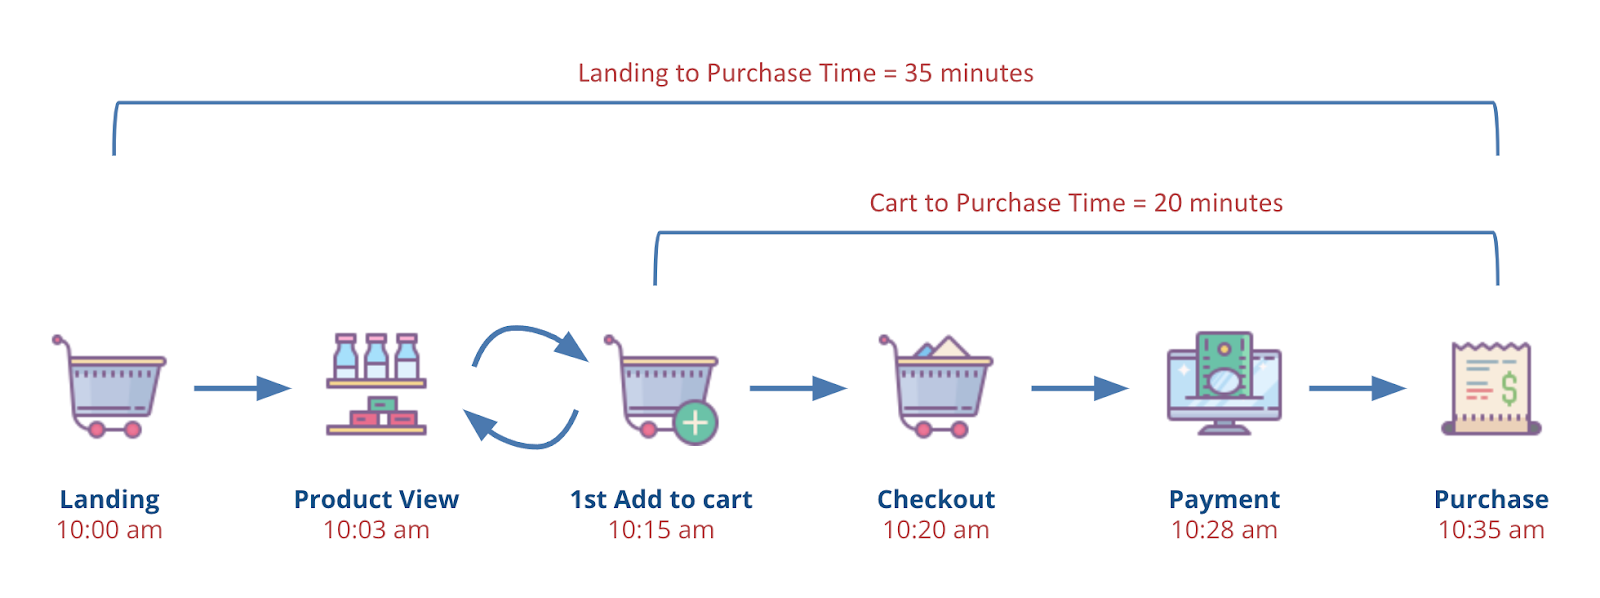
Conversion Duration measures the time taken from when a user first shows interest in a product until they complete a purchase. It offers valuable insights into the efficiency of the buying process and user decision-making behavior.
Scenario: A user lands on your e-commerce site during a holiday sale and adds a discounted item to their cart. However, they spend a significant amount of time browsing through reviews, comparing similar products, and considering the deal before finally proceeding to checkout and completing the purchase. Tracking the duration from cart addition to purchase completion can help understand the factors influencing the user’s decision time and identify opportunities to streamline the path to purchase, potentially reducing this duration and improving the user experience.
How to track in GA4:
1. Start by creating a “Cart to Purchase Time” custom metric to measure the journey from cart addition to purchase completion.
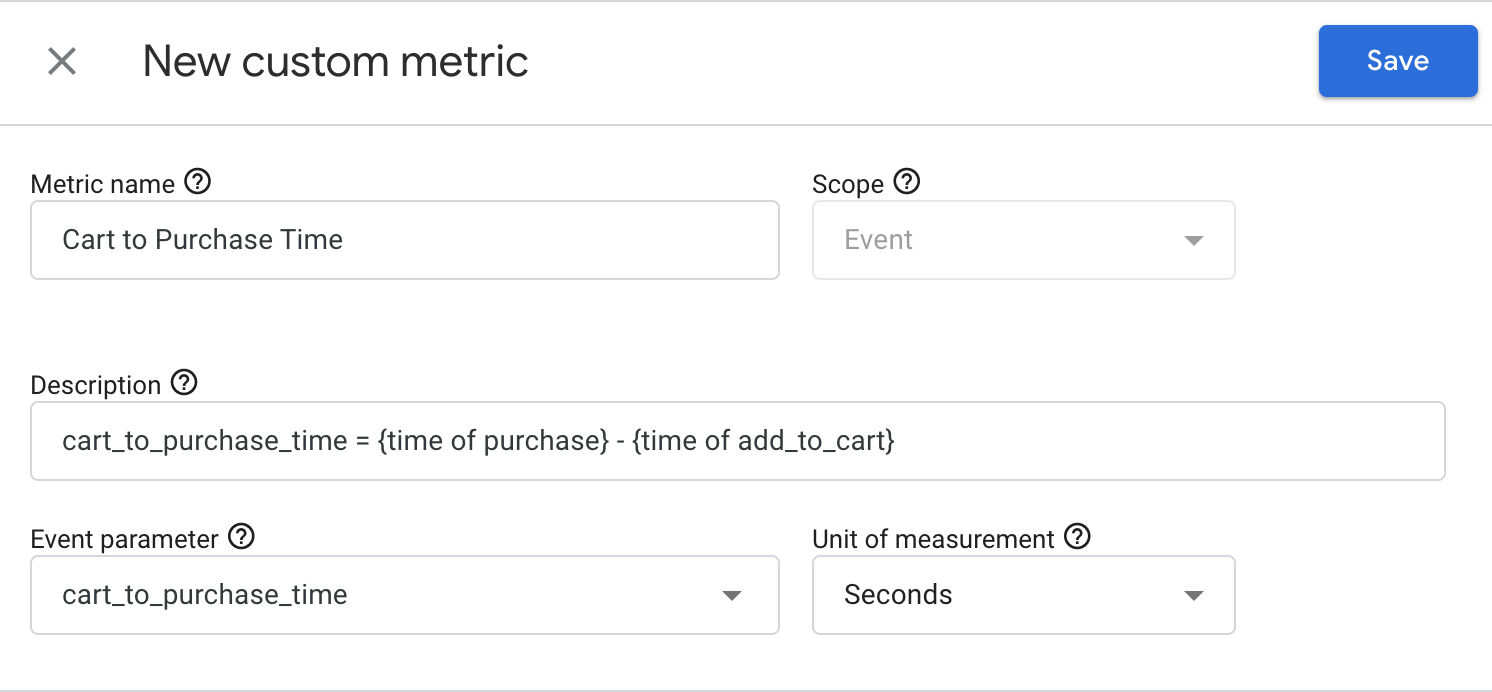
2. Duration Calculation: at ‘add_to_cart’, record the timestamp and store it. Then, at purchase, calculate the duration by subtracting the ‘add_to_cart’ timestamp from the ‘purchase’ event timestamp. Pass this duration as a parameter ‘cart_to_purchase_time’ with the ‘purchase’ event.
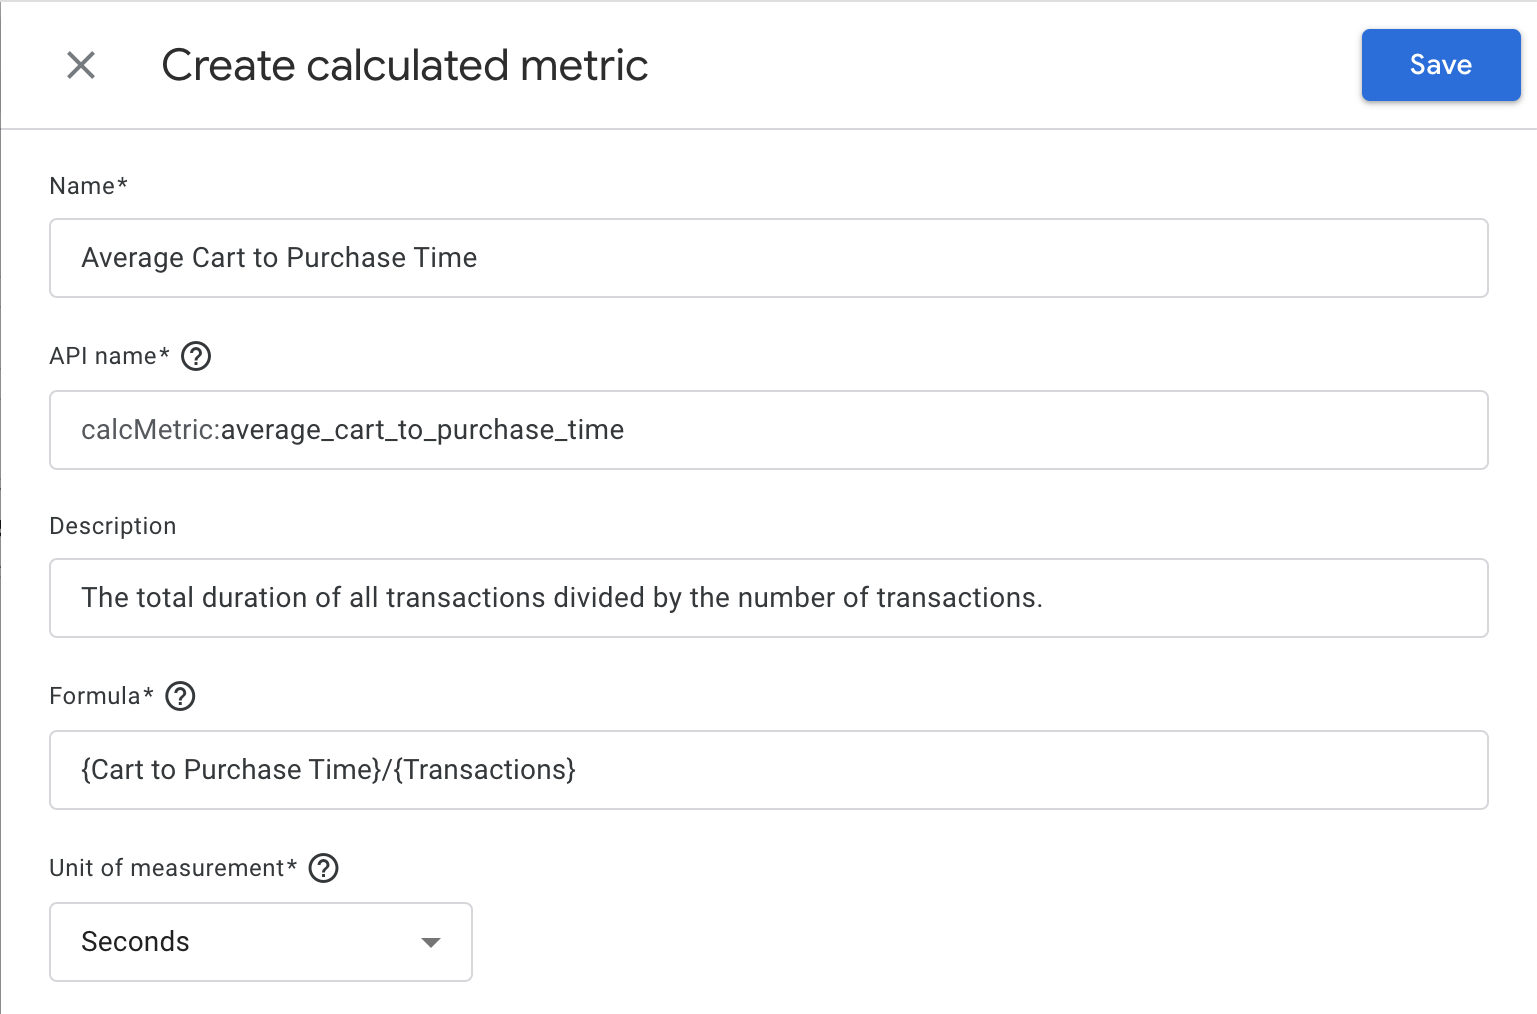
3. Create a calculated metric “Average Cart to Purchase Time” with the formula ‘{Cart to Purchase Time}/{Transactions}’, measured in seconds. This averages the time taken for purchases across transactions.
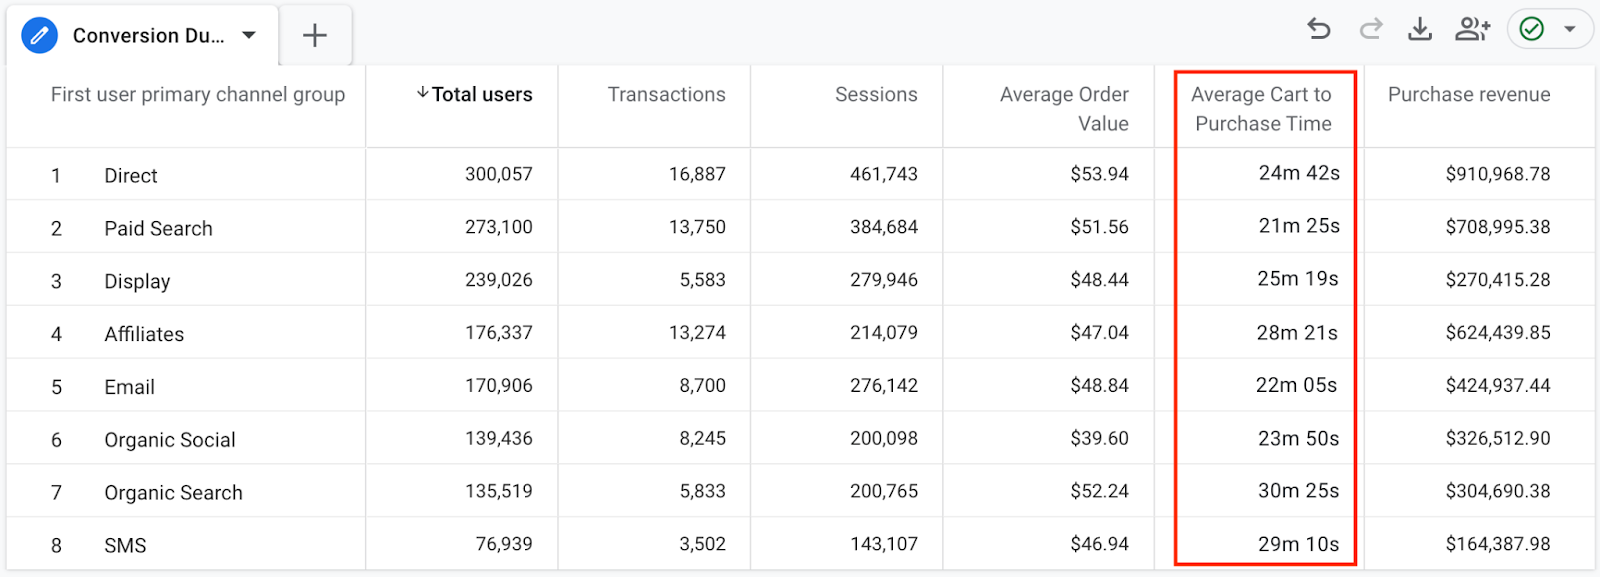
4. Use GA4’s exploration tool to examine the “Average Cart to Purchase Time” against various dimensions, identifying factors that impact the buying process.
Additional Insight:
For a full conversion timeline from site entry to purchase, track ‘session_start’ timestamps and apply the above methodology to measure overall conversion time.
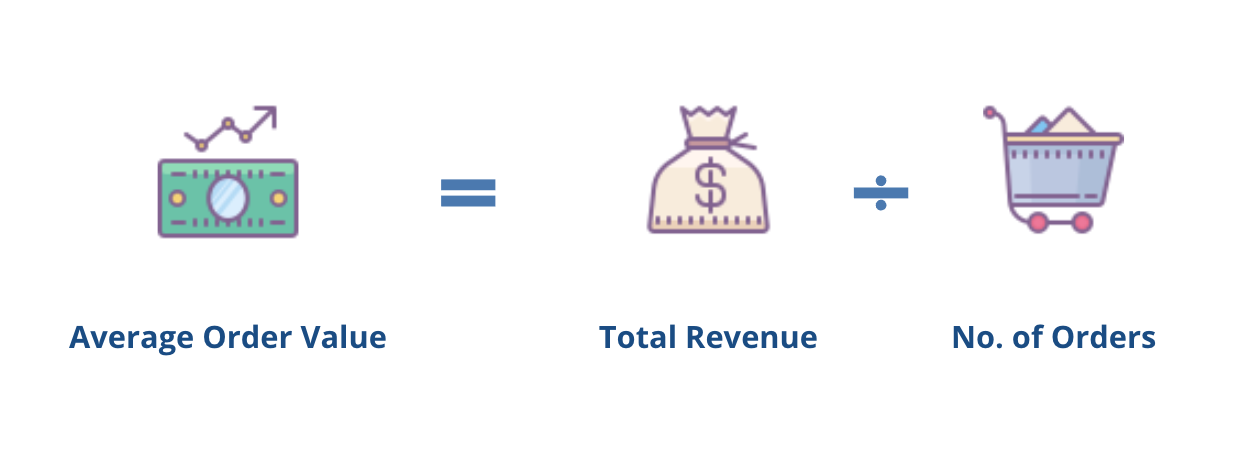
Average Order Value
The Average Order Value (AOV) metric helps businesses understand customer spending habits and evaluate the effectiveness of pricing strategies and promotions.
Scenario: Following the launch of a bundled product offer, you notice an increase in the overall transaction totals. By calculating the AOV before and after the promotion, you can assess the impact of bundling products on increasing the revenue per transaction. This insight can guide future product bundling decisions, pricing adjustments, and promotional strategies to enhance revenue generation.
How to Track in GA4:
Use the purchase event to track AOV.
Parameters: value (total amount of the transaction), and items (list of items included in the purchase). The AOV is calculated by dividing the total revenue by the number of transactions over a given period.
Payment Methods
Tracking user choices of payment methods provides insights into your shoppers’ preferred payment methods. The methods you provide and prioritize, from a UX standpoint, can impact their willingness (and ability) to complete a purchase. Understanding which payment methods are most popular or identifying those that lead to cart abandonment can guide optimizations to the checkout process and potentially increase conversion rates.
Scenario: After integrating a new digital wallet option into your payment methods, you notice a change in the checkout completion rate. Some customers start to choose the new option frequently, while others may abandon their cart at a higher rate due to confusion or a lack of trust in the new method. Monitoring the adoption and impact of different payment methods helps identify customer preferences and potential barriers within the checkout process.
How to Track in GA4:
Utilize the add_payment_info event when a user submits their payment information.
Parameters: payment_type (to capture the method used, e.g., credit card, PayPal, digital wallet), transaction_id, value (total value of the transaction), and currency.
Note that if you want to get even more granular data, you can track the selection of a payment type (e.g. credit card vs. PayPal) as its own event, not only track the payment type selected once the payment information has been submitted.
Shipping Methods
“Shipping Method” sheds light on customer preferences for delivery options, which can significantly influence their decision to complete a purchase. Tracking this metric allows e-commerce platforms to understand which shipping options are most appealing to their customers, such as free shipping, expedited delivery, or eco-friendly choices, and how these preferences affect checkout conversion rates.
By analyzing preferences for shipping methods and their impact on the checkout process, e-commerce sites can tailor their shipping options to meet customer expectations, potentially reducing cart abandonment and enhancing the overall purchasing experience.
Scenario: You introduce an expedited shipping option ahead of the holiday season, aiming to attract customers who need last-minute gifts. Observing how customers select between standard, expedited, or free shipping options at checkout can inform you about their priorities and willingness to pay extra for faster delivery. High selection rates for expedited shipping could indicate a successful feature, while a preference for free shipping might highlight cost sensitivity among your customer base.
How to Track in GA4:
Utilize the add_shipping_info event when a user submits their shipping information.
coupon, currency, items, shipping_tier, value.
Parameters: shipping_tier (e.g. Ground, Air, Next-day), value, coupon, currency, items.
Promotion usage, coupon redemption, etc.
Tracking usage of promotions, coupons, etc. can offer insights into how discount strategies influence customer behavior and impact sales. Tracking the use of promotional codes during the checkout process can help e-commerce platforms understand the effectiveness of their marketing promotions and identify opportunities to enhance conversion rates through strategic discounting.
Scenario: You launch a marketing campaign offering a 10% discount on all orders above a certain value with a promotional code. By monitoring the redemption of this coupon code, you can assess the campaign’s impact on driving sales and encouraging larger order values. This analysis helps in determining the attractiveness of the offer to your customers and identifying any potential issues with coupon code redemption that might hinder conversions.
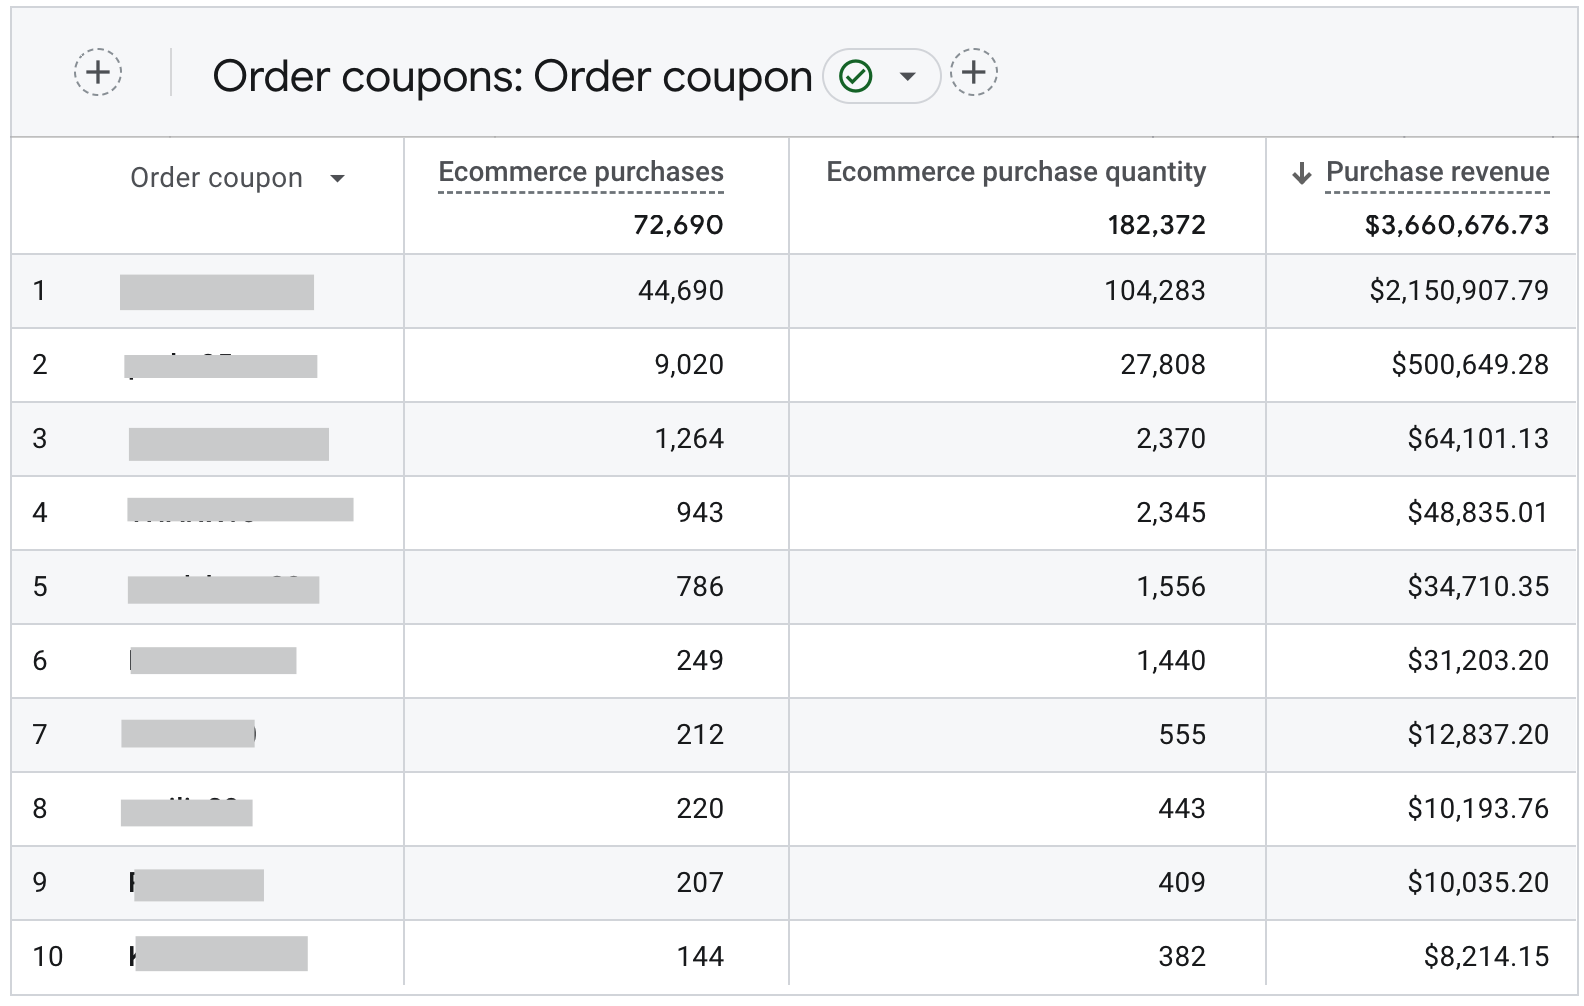
The Order Coupons report is a pre-made report in GA4 that shows the revenue associated with each coupon on your website or app.
How to Track in GA4:
Leverage the purchase event.
Parameters: transaction_id for identifying the purchase, value to capture the transaction amount, currency for the transaction currency, and items to detail the purchased items.
Parameters: coupon (the coupon name/code used), discount (value of the discount applied), and items (detailing the items included in the discounted purchase).
Note that, similarly to what we described above regarding payment options, if you want to get even more granular data, you can track coupon/discount code usage as its own event, instead of only tracking coupon/discount usage when it’s associated with a successful purchase. This can help you identify errors and other UX issues, such as those associated with outdated coupon codes.
Product Recommendation Engagement
Recommendation engines are a common tool in a retailer’s toolkit — GA4 can help you measure their effectiveness with a vendor-agnostic attribution model. Tracking customer interactions with products suggested on cart or checkout pages is fairly straightforward, and understanding how these recommendations influence additional purchases is crucial for optimizing cross-sell strategies and enhancing overall sales.
Scenario: When a customer adds a specific item to their cart, a section appears showcasing recommended products based on their current selection or browsing history. By analyzing customer engagement with these recommendations—whether they view, add to cart, or ultimately purchase these suggested items—you gain insights into the relevance and impact of your recommendation engine on driving incremental sales.
Note: While recommendation engines offer valuable insights into item-level interactions, they often provide a narrow perspective, concentrating mainly on clicks. By tracking these interactions within GA4, we gain the capability to comprehensively analyze the performance of recommended products across a wide array of dimensions—such as different marketing campaigns, device usage, geographical locations, and more. This broader analysis allows for an in-depth understanding of how recommended products perform in various contexts, offering actionable insights to optimize cross-sell strategies and boost overall sales through precise segmentation and targeted marketing efforts.

How to Track in GA4:
To capture customer engagement with recommended products, utilize the view_item, select_item, and add_to_cart events.
Parameters:
- item_list_name (e.g. Complete The Look, You May Also Like)
- item_list_id
- detailed items parameters such as item_id, item_name, price, quantity, etc.
Analyzing Engagement Metrics for Checkout Process Optimization
With GA4’s advanced reporting features, you can dissect these engagement metrics to pinpoint exactly where improvements can be made in the checkout process. For example, path analysis can reveal the common journeys users take leading up to a purchase, while funnel analysis can help identify where drop-offs occur in the checkout process.
Conclusion
Once users have added items to their cart, it’s time to “close the deal.” Providing users with a clear, helpful checkout experience is critical, and is an obvious opportunity to enhance an e-commerce business’ performance. By collecting and analyzing the engagement metrics we’ve outlined above, e-commerce professionals can unlock actionable insights to streamline the checkout experience, reduce cart abandonment, and increase conversions. However, the journey through e-commerce analytics doesn’t end with a purchase. Transitioning customers from first-time buyers to loyal, repeat purchasers is the next pivotal step. In Part 3 of our series, “Tracking Product Journey From Buying to Buying More,” we’ll delve into useful engagement metrics for measuring loyalty and retention. Until our next post, try out the metrics we’ve laid out in these first two posts and see what kinds of insights you can gain.