
Here at Merkle | Cardinal Path, we’ve been working with Google Analytics 4 (GA4) since 2019, when it was initially known as “Google Analytics App + Web.” Over the years, we’ve helped several hundred clients deploy GA4, and implemented GA4 across thousands of websites and apps. One topic that comes up in almost any GA4 implementation is the question of why the resulting data looks different from the historical data being collected in Universal Analytics (UA).
The truth is that there are many possible explanations for differences in data between UA and GA4, even when organizations have been careful to try to keep the implementation of the two platforms comparable. A few high-level reasons for variance include:
- As Google has stressed from the beginning, GA4 is not simply an updated version of UA. It is a new product, with a fundamentally different data model.
- Attribution works differently in GA4 than it did in UA, potentially leading to discrepancies in reporting, even across very similar implementations.
- GA4 includes modeled data (if Consent Mode is enabled), whereas UA has no capacity to do this.
Of course, every organization is different, and the list above doesn’t take into account the many possible nuances caused by customized implementations, configurations, settings, and the like. So, because this is such a persistent question, we have used our experience implementing GA4 to create some benchmarks for data variance between GA4 and UA.
In general, “discrepancies” between GA4 and UA tend to be minor, although individual situations can vary greatly.
Our research across 18 randomly-selected organizations with valid, comparable GA4 and UA deployments finds the following:
- Users: median discrepancy = GA4 +9.87% (i.e. GA4 records 9.87% more users than UA)
- Sessions: median discrepancy = GA4 +8.55%
- Pageviews: median discrepancy = GA4 +5.61%
As you can see, it’s normal for there to be a discrepancy between the two systems, which speaks to Google’s point that these two systems aren’t fundamentally the same. If you’re seeing discrepancies larger than the figures cited here, though, that doesn’t necessarily mean that something has gone wrong with your GA4 deployment. That’s because while our median discrepancies are in the 5-10% range, our data also shows some dispersion. Here’s a closer look. (For ease of viewing, two outliers have been removed.)
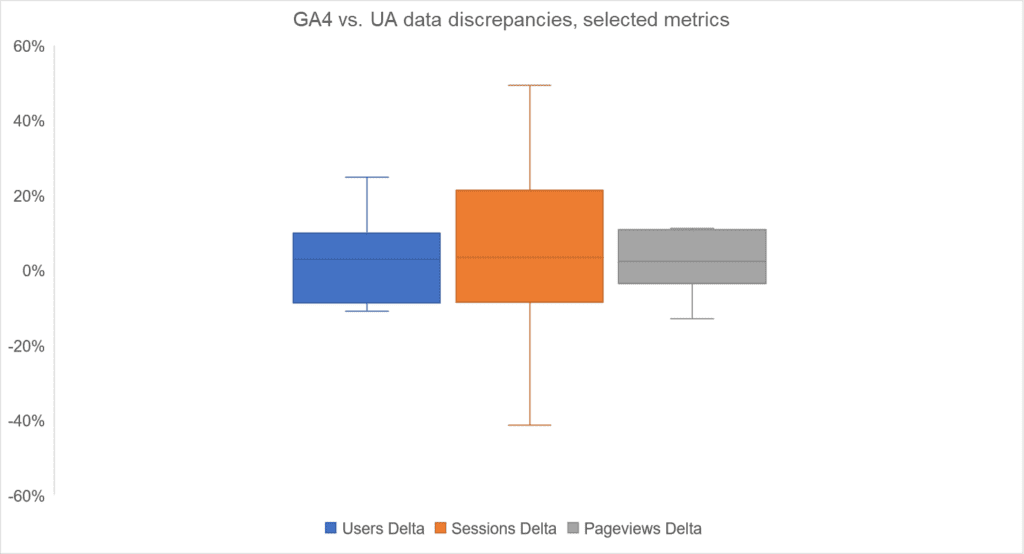
As shown here, the median discrepancies we cite above supply a simple benchmark, but there’s also a range of discrepancies that organizations might see. For example, when comparing sessions in GA4 against UA, 50% of our examples fall roughly within the range of a -10% discrepancy (i.e. GA4 reports 10% fewer sessions) to a +20% discrepancy.
It’s also interesting to note that pageviews, which we’d expect to have relatively small variance across platforms (they aren’t subject to any back-end processing or resolution that may vary between GA4 and UA) show a fairly “tight” dispersion, while sessions — which are subject to back-end processing, which changed from UA to GA4 — show relatively larger dispersion. In any case, we hope that understanding the common ranges, in addition to the benchmarks, provides useful context when assessing whether you might have a GA4 implementation issue.
With the full, final sunset of UA getting ever closer, more and more organizations are taking a closer look at their GA4 data — and often validating it against UA. As you’ve seen here, it’s normal to experience discrepancies, but as long as they’re within a certain range, we would consider them to be reasonable. If you’d like a second pair of eyes on your GA4 data prior to the UA turn-down, get in touch with us.