
Part 1: Measuring Product Detail Pages (PDPs)
Welcome to the first installment of our series on building out a robust Google Analytics 4 (GA4) deployment for e-commerce. This series will guide you through the full buyer journey, from the moment a product catches the eye of a potential buyer, through to the pivotal purchase decision and beyond. In this post, we’ll focus on how you can best utilize GA4 to understand and optimize your product detail pages (PDPs) — but be sure to read the full series to ensure you’re making the most of GA4 to optimize your e-commerce business.
Understanding how users interact with PDPs — from initial browsing to the decisive action of adding items to the cart — is fundamental, as PDPs are often viewed as the “top of the funnel” for qualified buyers. By measuring a variety of PDP engagement metrics and leveraging GA4’s robust analytical capabilities, e-commerce businesses of all kinds can gain actionable insights that can drive conversions and enhance user experience for all.
Key Engagement Metrics to Track on PDPs
PDPs vary by business, but one thing they tend to have in common is that they support a lot of interesting user experiences. Businesses wanting to optimize the performance of their PDPs should be sure to capture data on all the important behaviors users might be taking on those pages. Below, we’ll dig into real-life scenarios to illustrate the necessity of tracking specific user interactions and the insights they can offer for e-commerce optimization.
The engagement metrics we discuss below are, in our experience completing hundreds of GA4 deployments, foundational for any e-commerce tracking effort. By sharing these insights, we aim to provide a robust framework that can be adapted and expanded upon to meet the unique needs of your business. While the names that you give these events and metrics may vary — we hope you’ll find a lot below that you can implement.
1. PDP Exposure
Tracking PDP exposure is crucial for understanding the effectiveness of a site’s navigational structure in guiding users to specific products.By monitoring how often PDPs are viewed, and identifying the originating product list or category page, businesses can gain insights into user preferences and behavior. This data is invaluable for optimizing site architecture and promotional strategies to enhance product visibility and user engagement.
Specifically, this data can help in making informed decisions on how to adjust navigation elements, how to highlight products more effectively, and ultimately, create a more intuitive and effective browsing experience that aligns with user preferences, encouraging deeper exploration and increasing the likelihood of conversion.
Scenario: Consider an online clothing retailer that has recently restructured its site navigation to better highlight its eco-friendly product line. By tracking product page exposure from within the site navigation, the retailer aims to understand how often details of these eco-friendly products are viewed and from which product list or category page they are most frequently accessed.
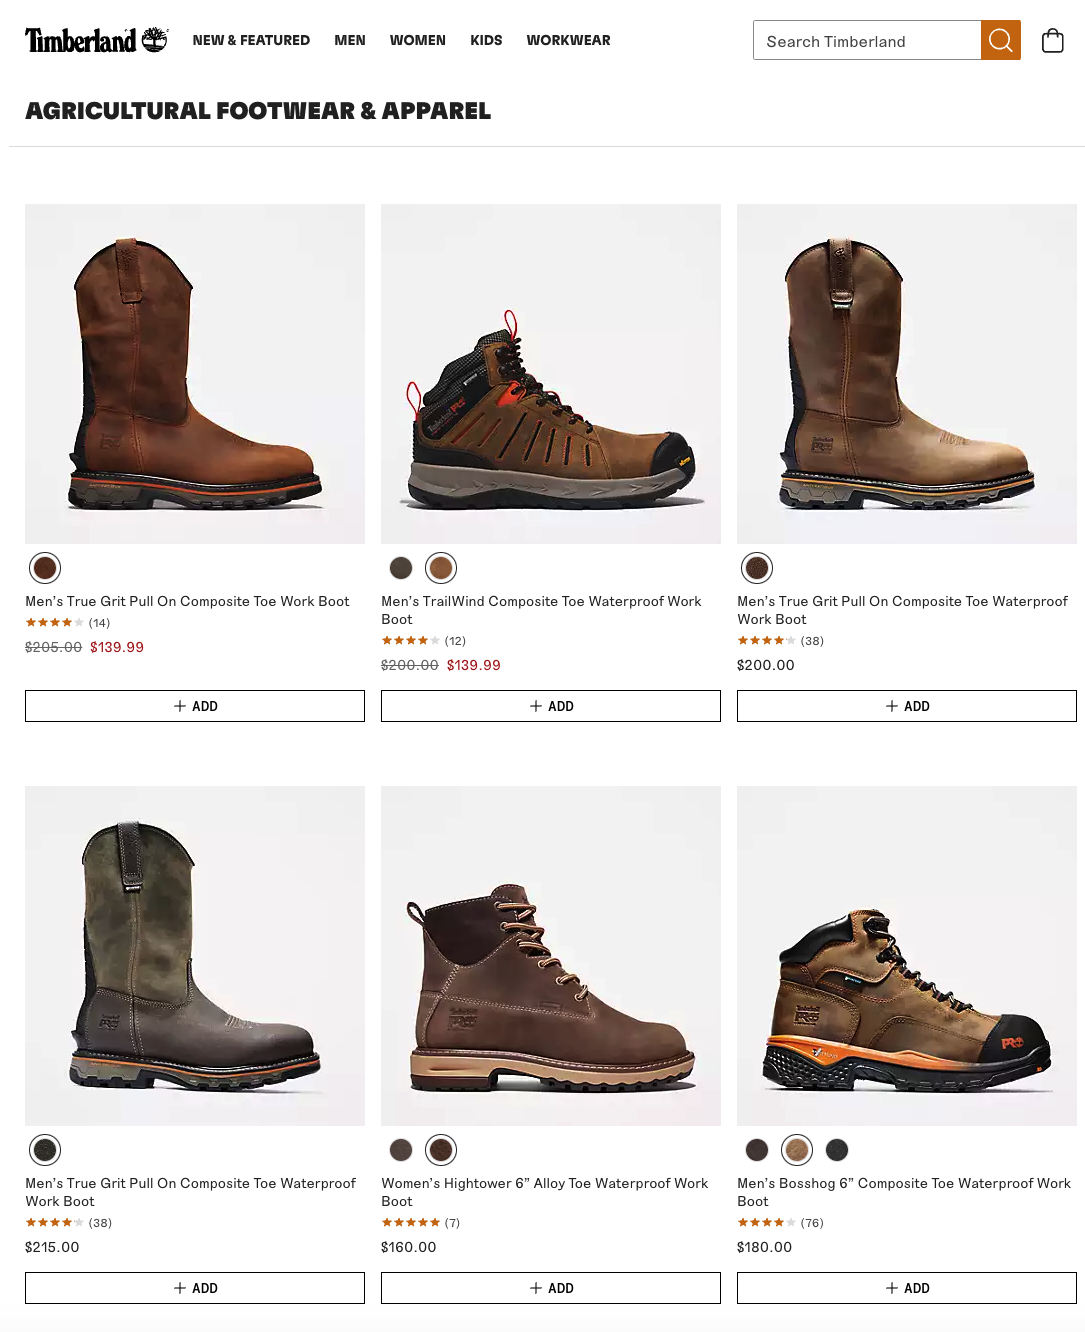
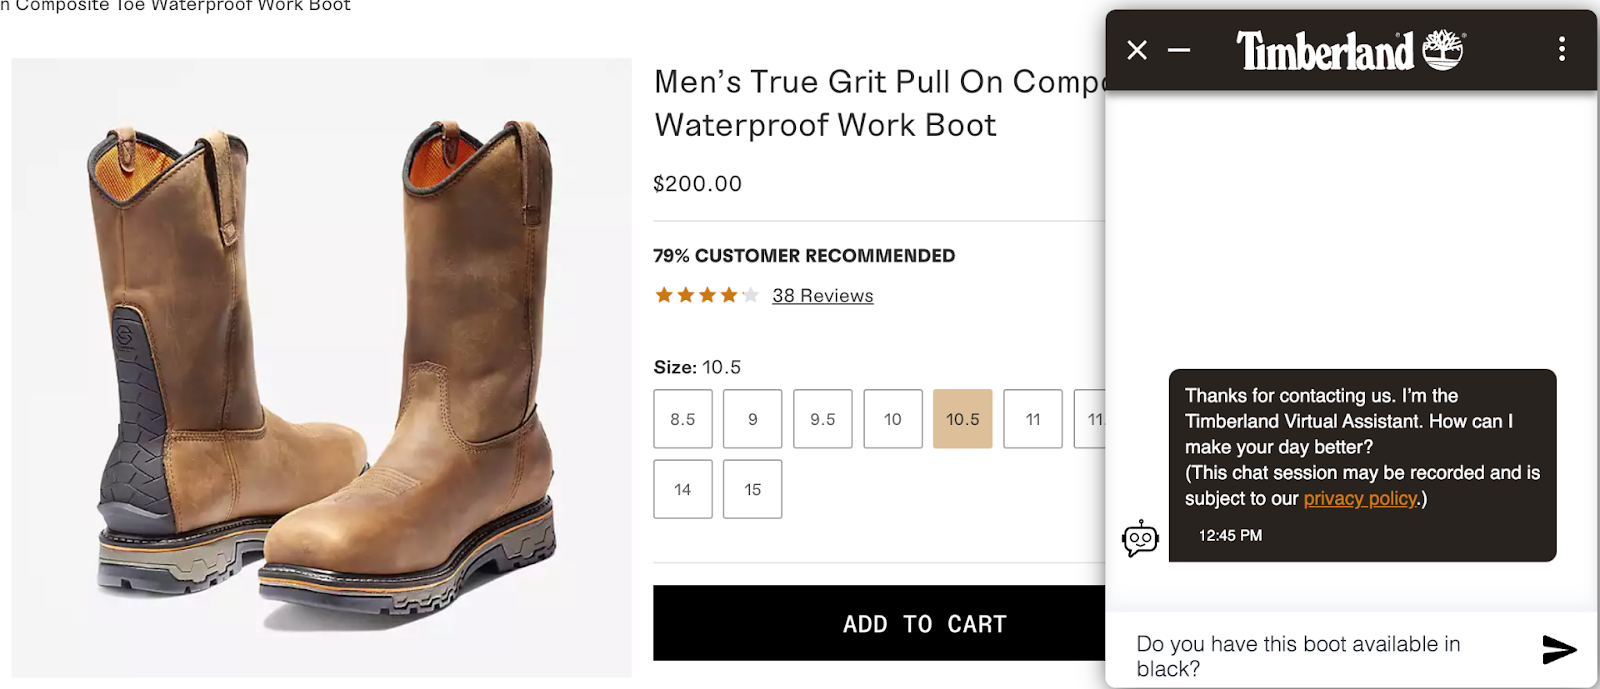
Images throughout this post courtesy of Timberland, and used for illustrative purposes only. Timberland is not affiliated with Merkle | Cardinal Path in any way.
How to track in GA4:
Recommended event(s):
- view_item, select_item events to track when users view or select items
- view_item_list event to track when users view product lists or categories.
Parameters: item_list_name (to identify the specific list), and items (an array of item details viewed or selected).
2. Product Ratings and Reviews
Ratings and reviews can be significant influencers of purchase decisions. Monitoring these can help you gauge product reception, identify areas for improvement, and leverage positive feedback in marketing materials to boost confidence in potential buyers.
Scenario: A new product line is launched, and early adopters start leaving ratings and reviews. Tracking these interactions can highlight the initial consumer sentiment and identify any potential issues or standout features that could influence future sales.
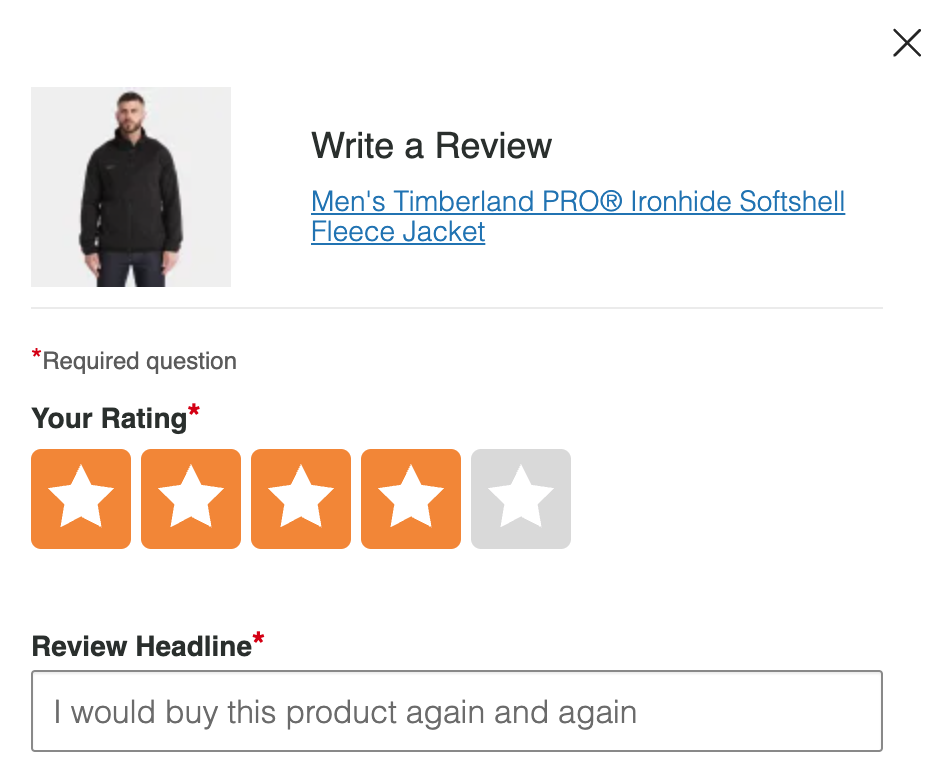
How to track in GA4:
Custom Events: rate_product & review_product.
Parameters: item_id, item_name, rating_value (for ratings), review_text (optional for capturing review content).
3. Add-to-Cart
The “Add to Cart” event is a direct indicator of purchase intent. Tracking this action helps understand what drives users to consider a purchase, allowing you to refine product presentations and offerings to maximize conversions.
Scenario: After enhancing product descriptions with more detailed specifications and high-quality images, there’s a noticeable increase in users adding items to their cart. Tracking these actions can validate the impact of content enhancements on conversion readiness.
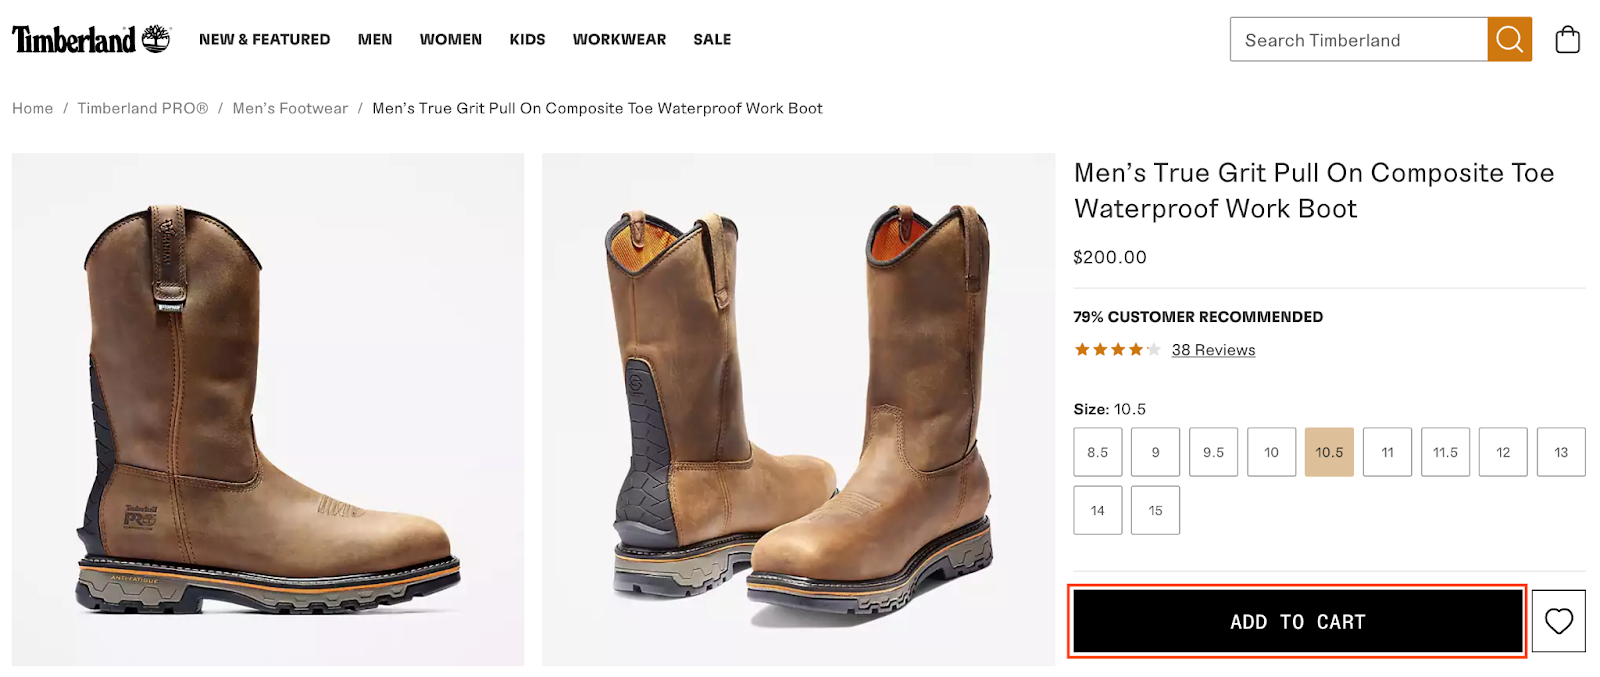
How to Track in GA4:
Recommended event: add_to_cart
Parameters: currency, value (total value of the item added), items (array including item_id, item_name, quantity, and price).
4. Unsuccessful Add-to-Cart
Identifying the reasons behind unsuccessful attempts to add products to the cart can reveal critical usability or inventory issues, guiding necessary adjustments to streamline the shopping experience and reduce abandonment.
Scenario: Products requiring selections (color, size, quantity) before adding to the cart might see abandonment if options are not clearly presented or available. Tracking when users fail to add items due to missing information or stock issues is critical.
How to Track in GA4:
Custom event: attempted_add_to_cart.
Parameters: error_message (describing the reason for failure), item_id, and product_details (like size or color that was being attempted).
5. Tracking Out-of-Stock Products
Keeping tabs on out-of-stock notifications allows you to understand the demand for specific products, informing restocking priorities and enabling proactive communication with customers about restock dates or alternative recommendations.
Scenario: A popular item is frequently out of stock, leading to potential customer disappointment and lost sales. Tracking events related to out-of-stock notifications can help assess the impact of inventory shortages on customer experience and sales.
How to Track in GA4:
Custom event: item_out_of_stock.
Parameters: item_id, item_name, and stock_status (to indicate out of stock).
6. Add to Wishlist/Favorites
The “Add to Wishlist” feature is a subtle yet powerful indicator of user interest. It signifies that users are contemplating a product, marking it for future reference rather than making an immediate purchase. This action is crucial for understanding long-term interest and potential sales opportunities.
Scenario: A user browsing through a collection of new electronic gadgets decides to add several items to their wishlist, planning to compare features and prices at a later time. By tracking these wishlist additions, you can gauge interest levels in specific products and identify trends in user behavior. This insight allows for targeted follow-ups, such as sending personalized notifications about price drops or availability, encouraging users to move from contemplation to purchase.
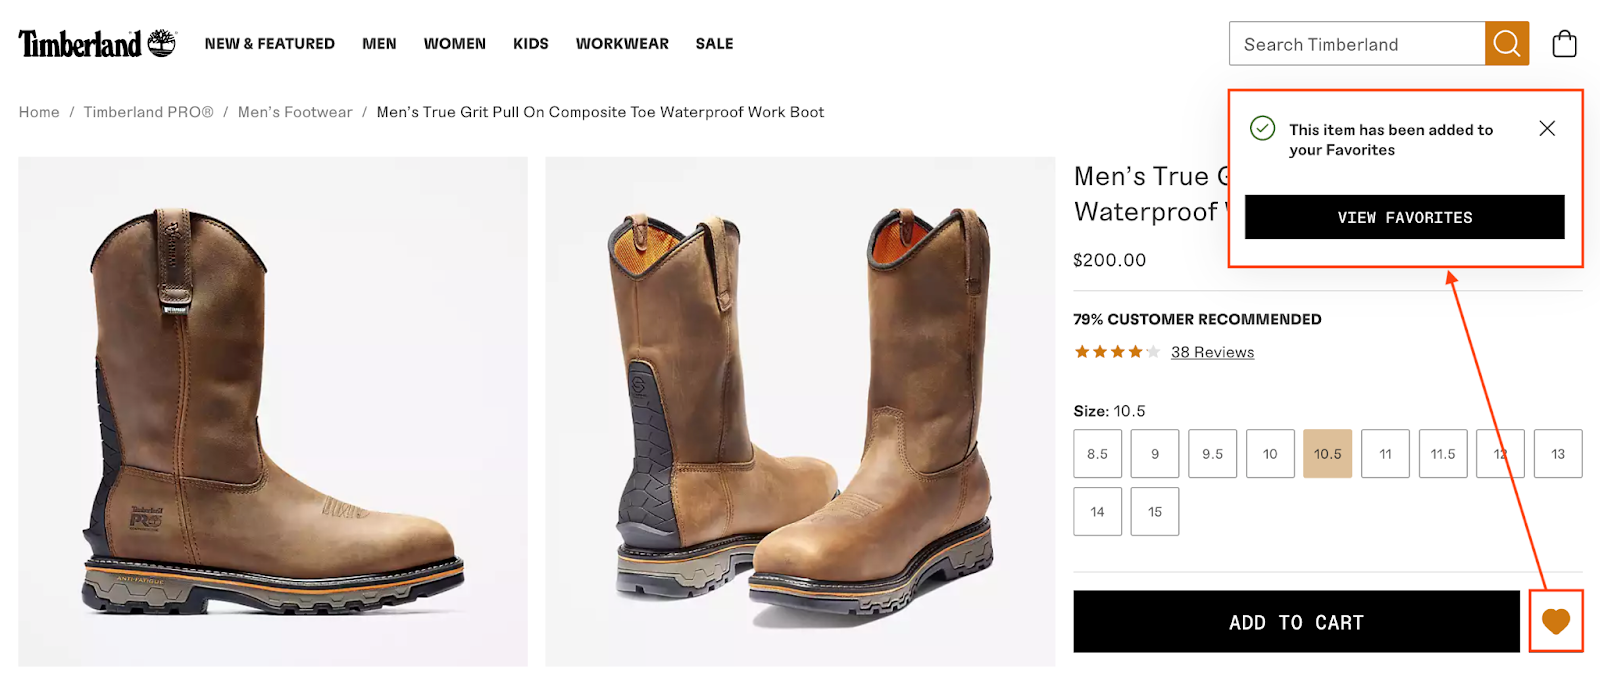
How to Track in GA4:
Recommended event: add_to_wishlist.
Parameters: item_id, item_name (and all related attributes).
7. Social Shares and Interactions
Social shares and interactions are useful indicators of product popularity and user engagement beyond the confines of your website. This metric reflects how often users find your products compelling enough to share with their networks on social media platforms. It’s a powerful tool for gauging public sentiment and extending product visibility through organic reach.
Scenario: A new line of eco-friendly apparel is introduced on your e-commerce site, and you notice a significant uptick in social shares and interactions related to these products. By tracking these social metrics, you can identify which items resonate most with your audience, providing valuable insights for future marketing campaigns and product development. Increased social activity can also amplify word-of-mouth marketing, driving more traffic to your site and potentially boosting sales.
How to Track in GA4:
Recommended event: share.
Parameters: method (where the item was shared, e.g., Facebook, Twitter), item_id, item_name, content_type (e.g. product).
8. Contact Virtual Assistant
“Contact Virtual Assistant” is an engagement metric that measures user interaction with automated customer support, AI chatbots, and the like on your e-commerce platform. It highlights the users’ need for assistance or more information, which can be crucial for decision-making before a purchase.
Scenario: A customer is considering purchasing a high-tech gadget but has specific questions about compatibility with their existing devices. They use the virtual assistant feature to ask their questions. Tracking these interactions reveals not only the common concerns customers have about your products but also their reliance on virtual support for immediate assistance. High engagement with virtual assistants can indicate areas where product information might be lacking or where customers most often require clarity, guiding you to enhance content on product pages or improve the virtual assistant’s knowledge base for better customer support.
How to Track in GA4:
Custom event: contact_virtual_assistant.
Parameters: item_id, item_name, question_type (to categorize the inquiry).
9. Gift Registry
“Gift Registry” engagement is a valuable metric for e-commerce platforms, especially those that cater to wedding, baby, or housewarming markets. Tracking interactions with gift registries can provide insights into how customers are planning for special occasions and the types of products that are most desired as gifts. This metric helps in understanding the role of gift-giving in purchase decisions and optimizing the registry experience to encourage more registrations and fulfillments.
Scenario: A couple setting up a wedding registry on your site adds a variety of items ranging from kitchen appliances to home decor. Monitoring the creation of gift registries and the addition of items to these registries can reveal popular products and categories for gifting. Furthermore, tracking which items from registries are purchased by guests offers insights into gift preferences and purchasing behavior, allowing for targeted promotions and stock adjustments.
How to Track in GA4:
Custom events:
- create_gift_registry (to be fired when a new registry is created)
- add_to_gift_registry (to be fired when items are added to an existing registry)
Parameters for create_gift_registry: registry_id, event_category (e.g., wedding, baby), and registry_owner.
Parameters for add_to_gift_registry: item_id, item_name, registry_id, and quantity.
Additionally, tracking the purchase_gift_registry_item event can help understand how often items from registries are bought, providing a complete view of the gift registry lifecycle from creation to fulfillment.
Notes on Event Tracking Implementation
When implementing event tracking, it’s crucial to capture comprehensive product details to enrich your data analysis capabilities. Detailed product information, such as size, color, and category, enhances your understanding of consumer preferences and behavior.
Adopt a Structured Naming Convention:
To maintain clarity and consistency across your data, it’s advisable to follow a structured naming convention for your event parameters. This approach ensures that data is easily interpretable and actionable. For example:

Analyzing Engagement Metrics for Optimization
Once you’ve gotten all the interesting behaviors on your PDPs tracked, you’ll be ready to start making full use of GA4’s analysis tools. To learn more about these in general, consider reading up on Explorations. Below are a few of the most common ways you’ll put your PDP engagement data to use:
- Path Analysis: Use path analysis to understand the sequence of interactions leading to cart additions, pinpointing where optimizations can encourage further engagement.
- Funnel Analysis: Apply funnel analysis to visualize the progression from product page exposure to cart addition, identifying drop-off points and testing hypotheses to improve conversion paths.
- Segmentation and Audience Building: Create segments based on engagement metrics to target users with personalized marketing strategies, improving the likelihood of conversion.
Conclusion
While PDPs are only one stage of the purchasing journey, they’re filled with opportunities for insight and optimization. The metrics we’ve discussed here equip e-commerce professionals to significantly improve the shopping experience, leading to higher conversion rates and a deeper understanding of consumer behavior on product pages.
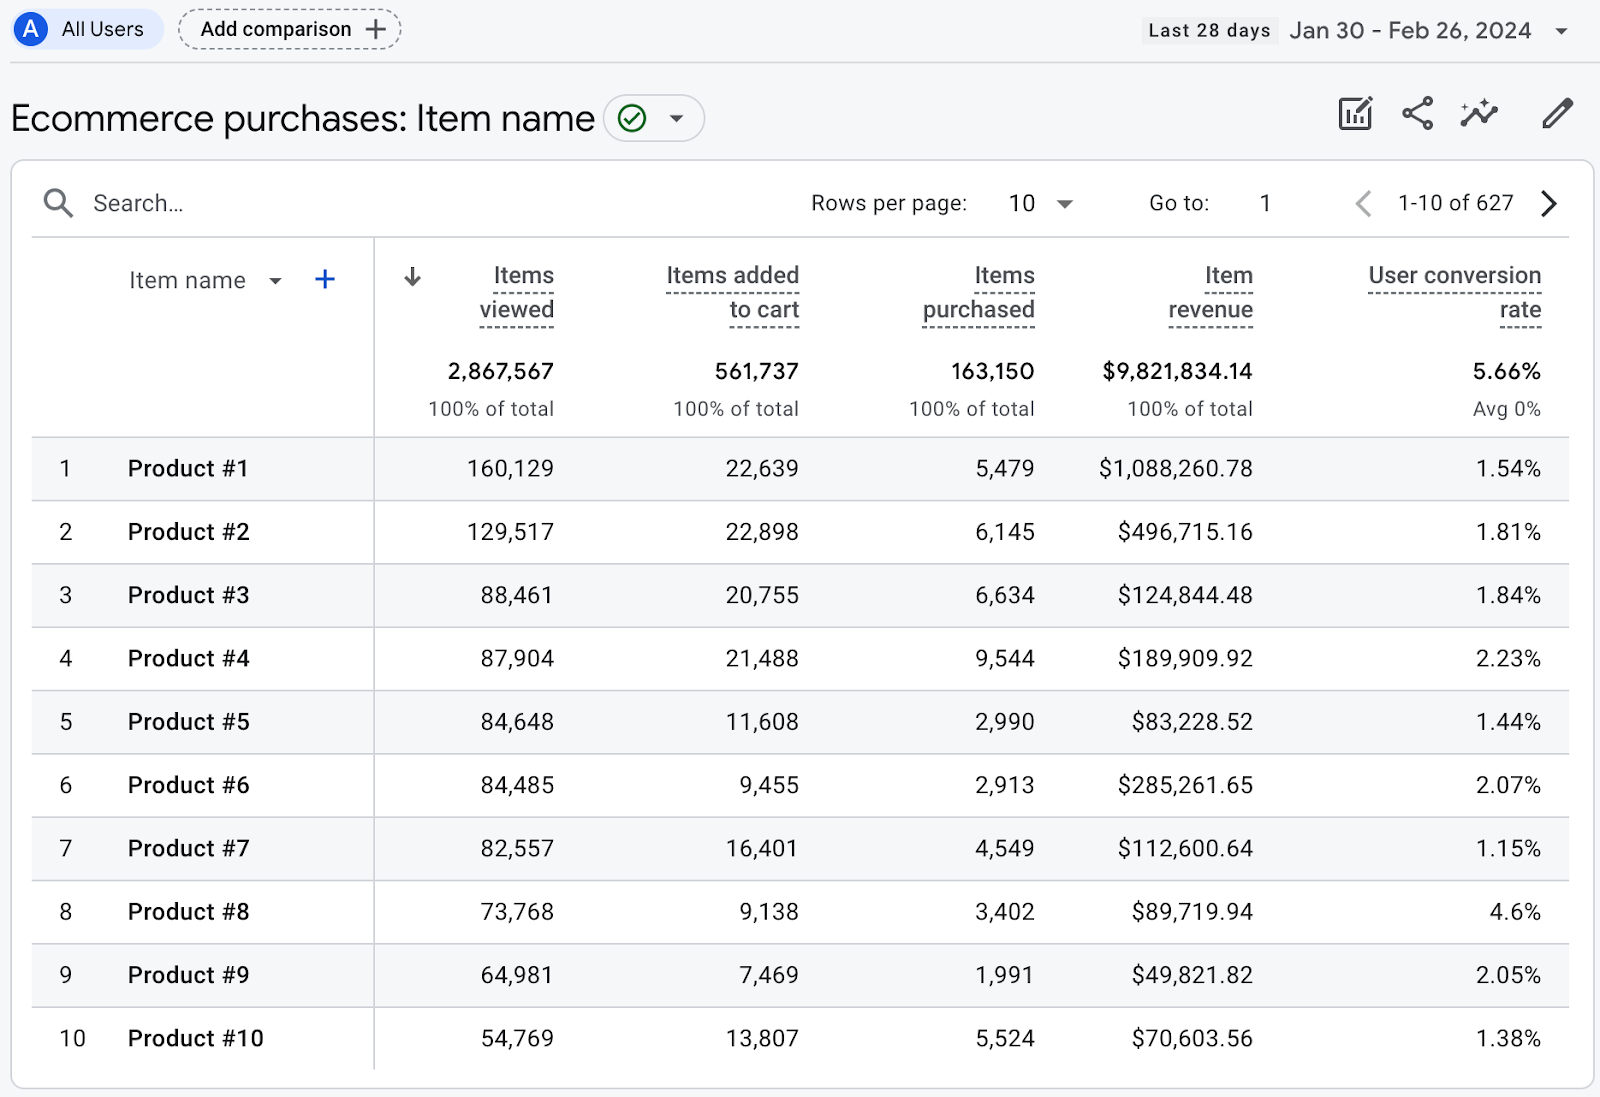
As you begin to have a more robust implementation of GA4, the reports you’re able to create will be more detailed — and the insights you derive from them more actionable. When you’re looking at a data table like the one below, and wondering where you have optimization opportunities to drive higher conversion rates, capturing all of these PDP engagement metrics will significantly increase the chances that you can make measurable improvements to your PDPs’ performance.
Stay tuned for our next post, where we’ll navigate the crucial steps from add-to-cart to purchase, identifying further metrics you can use for e-commerce optimization. Until then, we encourage you to start implementing the metrics, and making use of the resulting data.