Every now and then, we like to get “back to basics”. We still find established, experienced clients making simple mistakes that could easily be avoided and corrected using basic features already available in Google Analytics. One of them is properly using annotations – basically taking notes on different events (internal or external) that impact your site. These “sticky notes” might seem insignificant, but can often be a life-saver, providing insight as to why your data sometimes looks the way it does, especially anomalies or outliers.
Let’s talk about some strategies and best practices as to when and how to create valuable Google Analytics annotations.
What Are Annotations in Google Analytics
In early 2010, Google Analytics introduced annotations. Annotations offer a simple way to track notes in the Google Analytics reporting interface by date, so you can mark important events based on that may have impacted your data in otherwise seemingly inexplicable ways. In this way, it can explain reasons for jumps in the data to your entire team (if shared with everyone) that otherwise may be unclear.
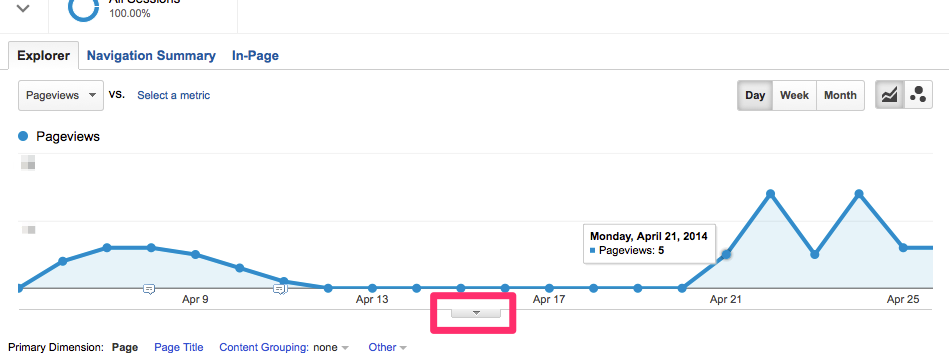
To create annotations, simple go to any report and click the down arrow on the tab at the bottom.
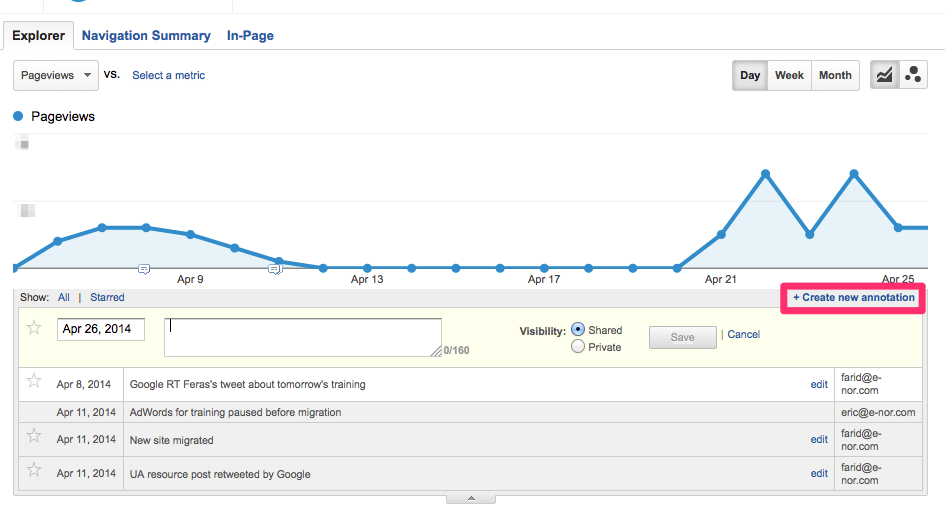
Click “Create New Annotation”. Enter the date of the event and a small note about what happened. Choose if you’d like the note to be private or public.
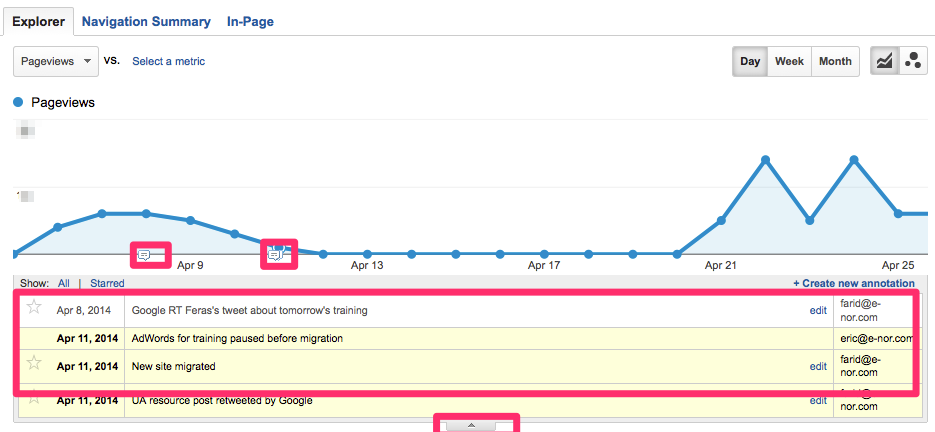
Viola! Annotations are indicated by the tiny little talking bubbles at the bottom. To see the details, click the “down arrow tab” again for a list of annotations. The notes stay is available on any report in case your dissecting the data, see something weird, and need some insight into what happened that day!
The Benefits of Using Annotations
There is a spike in your data, a sharp increase, a drop, flat-line, etc., and you have no idea why. Wouldn’t it be nice to have an clear explanation or clue as to why any of this happened?
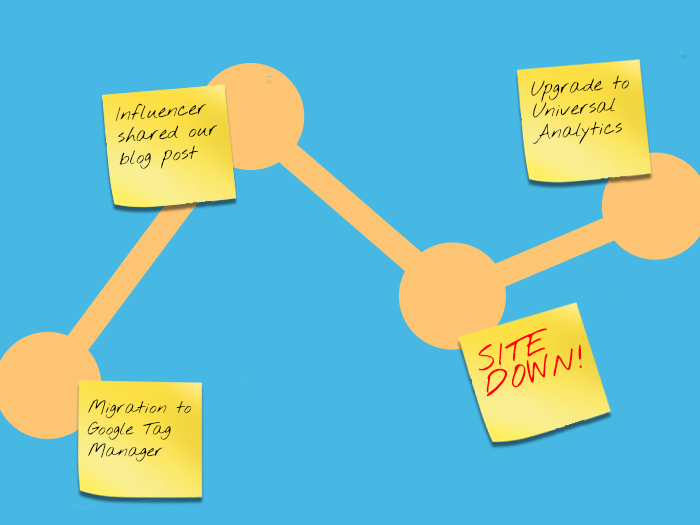
Imagine the following scenario.
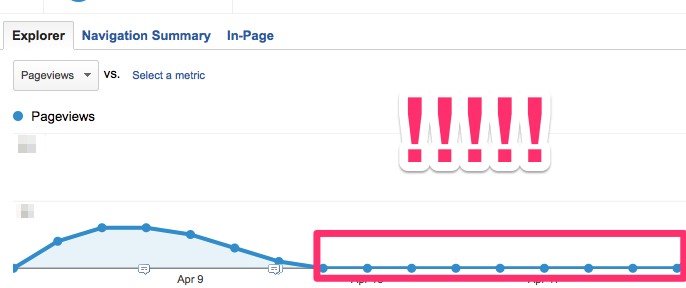
The traffic for your company’s most valuable landing page died for 2 weeks. Someone’s paycheck is about to get cut!
You’re the marketing manager and you have a meeting with your CFO in 5 minutes. Sure, you could spend hours combing through emails, trying to figure out last week if your development team made an update to your site that tanked ecommerce. Luckily, you annotated exactly on that day that your developers switched to Google Tag Manager. You check with them, and they forgot to publish your new version of Universal Analytics code. You check the bank account, and sure enough, the money is still coming in, it’s just the data is missing. (Phew!)
Another example might be that an influencer shared your page to 1,000,000 followers, and for 2-3 days, your traffic has increased by thousands of visits. For something like that, there is no email paper trail that can lead you to the cause, and now, you’ve lost a potentially valuable partner that has a genuine interest in you that could help you blast your next campaign. It would have been best to “sticky note” or annotation right when it happened.
How to Use Annotations: 5 Tips on What to Annotate
1. Be explicit.
There’s nothing more frustrating than an incomplete clue to a burning mystery. “Blog Post shared”. What the heck does that mean? Who shared it? Which post? The worst part is I don’t understand my own note! If you’re notes are mysterious, you’re wasting your time creating it in the first place if no one’s going to understand it. While you only have a handful of characters (160), be as detailed as possible – it’s plenty of room to get specific points across.
2. Keep in mind who will be reading it in the future.
In the cases of shared annotations, you aren’t the only person who will be reading these notes. Your analysts, marketing team, etc., will be reading them and potentially using them for analysis and insights. For example, chances are if you use personal abbreviations, they’ll be interpreted in a way you didn’t intend. So when you wrote “ICBINB” to mean “internet consultant Brian implemented new banner” your colleagues will be wondering why you noted “I Can’t Believe It’s Not Butter”. Make sure your notes are understandable to any one reading it without context.
3. Record marketing campaigns, online and offline.
As mentioned, many things can affect your traffic, and you want to know what those things are. Obviously online campaigns probably will. If you release an email blast to 1000 subscribers, if even 10% click through, that’s 100 extra visits, so you’ll want to know what caused that when you look at your data a month later. But what about a TV ad? A radio ad? Flyers you passed out at the bus stop? That could increase traffic too, and you obviously want to know what offline campaigns worked the best for you. Log as much as you can.
4. Record any update or issue to the site/app.
When updating your website, you QA furiously to make sure nothing breaks – not SEO, not Analytics. Unfortunately, best laid plans don’t always come through. If you’re not looking at your data regularly, a change to your site that affects your tracking code may be discovered late. At this time, usually you’re in panic mode, so minimize your stress by being diligent noting site updates. Usually, these notes can give you direction into exactly what happened and exactly how to fix it.
5. Record any external event that may affect you traffic.
In March, you meet Tim Cook on the street and give him your card. Next thing you know, Apple tweets your site to millions of followers. You think it’s awesome. At the end of the year, you’re analyzing how some of your campaigns are doing and it looks like for some reason March traffic skyrocketed. You want to do that again! You drill down deeper, turns out one day spiked your data, but you can’t remember what happened that day! If you had annotated that you met Tim Cook and that he tweeted, you could filter that day out for a more accurate trend.
Conclusion
Hope that helps and gives you a new appreciate for such a basic but useful feature in GA. Have special uses for annotations? Leave a tip or trick in the comments!


