Yesterday, we took a look at four new features of Google Analytics that can help you take your usage of analytics to a whole new level – all without having to implement any new code on your website. Today, I’ve got four more features for you to know about. Read on for three exciting new features, plus one oldie-but-goodie.
Cool New Feature #5: Google Webmaster Tools Integration!
This is a truly underappreciated feature. Google Analytics already gives you rich, keyword-level data on all of the various terms that bring organic searchers to your site. However, like any analytics tool, GA has traditionally been unable to measure anything that doesn’t happen on your site – but no longer! Google Analytics, with the new Webmaster Tools integration, now gives you keyword-level data on what happens before the click. In other words, in addition to seeing how many visits you get on a given term, you can now see how many searches there were in the first place. You’ll also see your clickthrough rate (CTR) and average ranking (position) for any given term. Let’s take a look at this fantastic data by checking out the Queries report in the new Search Engine Optimization module.
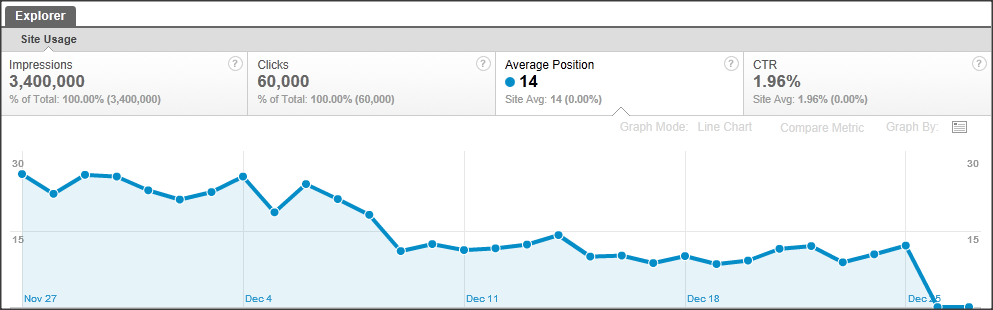
First, you’ll notice you get a trendline graph which will show you your total impressions, clicks, average position, and CTR. Above, we can see that our average position is getting “lower,” which means that we’re actually ranking better over time (remember a position of 1 would be the highest possible). We can drill down, however, and see how we’re performing for various groups of keywords.
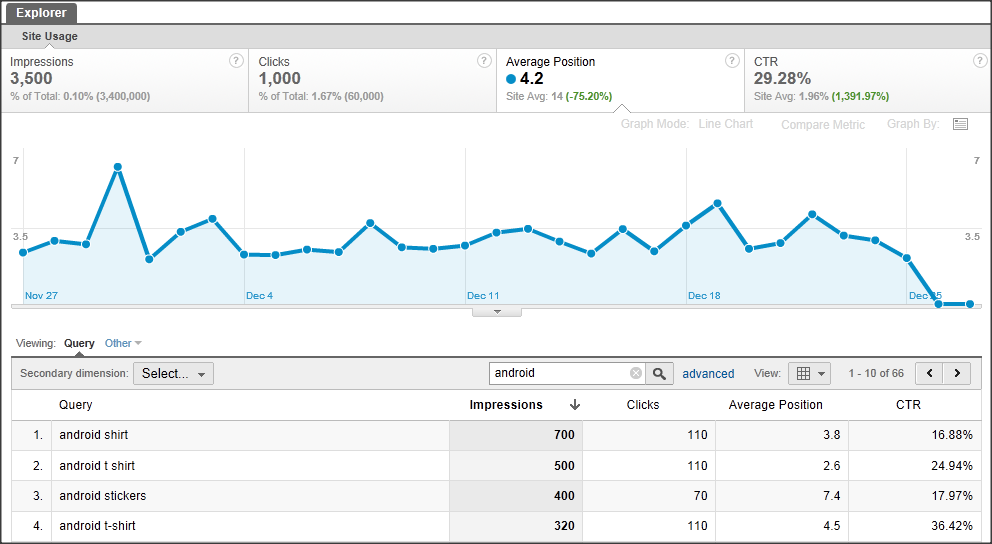
For example, I’ve searched the Queries report for all search terms containing the term “Android.” Now, I can see that my average position for these terms is 4.2, which is much better than my average of 14.
This raises the question: which groups perform far worse than average in terms of positioning of clickthrough rate? Which queries could I be getting a lot more traffic from? Why are certain groups of terms performing much better than others? You can use the new SEO Landing Pages report to get some more insight on which of your pages are ranking for various terms, but for now, we’re going to move on to our next exciting feature.
Cool New Feature #6: Multi-Channel Funnels!
There are plenty of people out there who think this is the biggest advancement Google Analytics made in 2011, and it’s hard for me to disagree with them. I’ve written extensively on this topic already, but if you’re new to Multi-Channel Funnels (MCF), here’s a crash course.
Google Analytics currently uses a “last-click” attribution model, meaning that any conversions, transactions, etc., that happen on your website are credited toward the last source of traffic that brought a user to your website. For example, if I come to your site via a Google search, and then again via a Bing search, and then I buy something, that transaction and all of its revenue are attributed to Bing by Google Analytics. Is that right or wrong? Well, it’s just one attribution model. To get past this single view of your conversions, Google introduced MCF so that you can see all of the “touch-points” that lead to conversions. A key concept in MCF is the “assisted conversion,” or more simply, the “assist.” In the above scenario, Google’s MCF feature would still give credit to the Bing search, but it would give an assist to the Google search.
Let’s take a look at how this all looks in the new “Assisted Conversions” report in the Multi-Channel Funnels module.
What you’re seeing above in the highlighted box is assisted conversions and the value of those assisted conversions. Compare those numbers to the “last interaction conversions” (i.e., the normal conversions you’d already see) that are listed to the right. You’ll notice that for certain kinds of traffic, like Referrals and Social Network, there are actually more assists than actual conversions. This is a tremendous discovery! In a last-click attribution model, these Referrals and Social Network visits get shortchanged in terms of how much credit they get. MCF gives you – at long last! – the ability to get a fuller sense of how much value all of your traffic really adds for you. There are some other great reports in the MCF module – to learn more about them, check out my more in-depth blog posts here and here.
Cool New Feature #7: Events as Goals!
Event tracking can’t be called a “new feature” of Google Analytics anymore, but recently, Google updated its Goals feature to allow you to use your tracked Events as Goals. (Previously, only pages could be tracked as goals, e.g. /thankyou.html.) This is a huge deal! If you’ve been using Event Tracking track video, Flash, file downloads, outbound links, or anything else, you can now easily track these events as goals. This makes it really easy to get conversion rates for these events into things like custom reports, dashboards, etc. Let’s take a quick look at how event-based goals work.
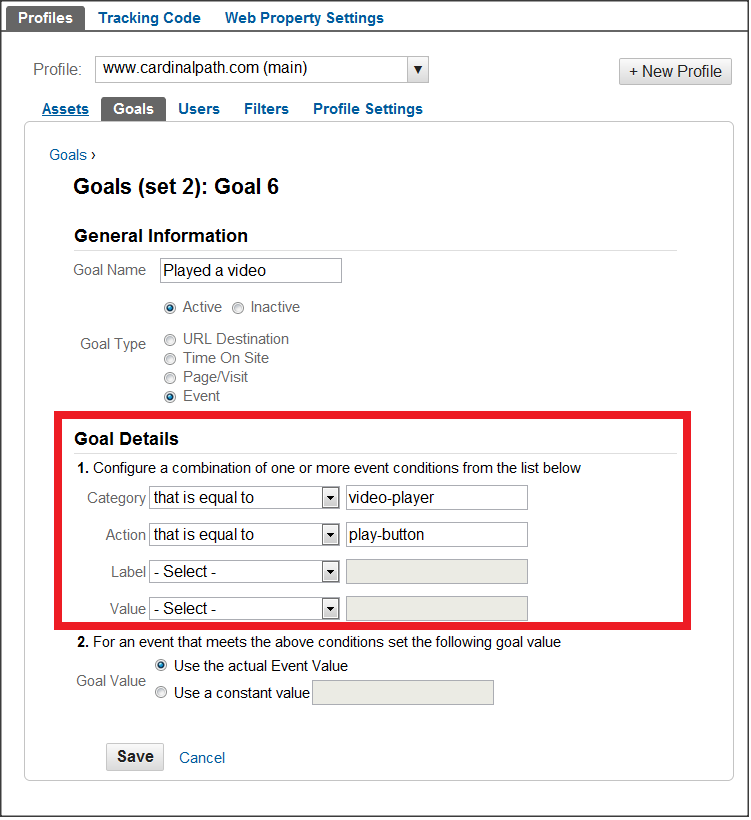
Here, you can see that we’ve chosen “Event” as our goal type. In this case, we want to track video plays as a goal. The beauty of event-based goals is that I can specify exactly which goals should count as goals by specifically listing out the proper event categories, actions, labels, and values (if necessary). Here, I’ve said that if the event’s category is “video-player,” and the event’s action is “play-button,” Google Analytics should record a conversion.
Of course, you can simply use your Event reports to get this data, but you only get gross totals. Setting up your events as goals will allow you to easily get conversion rates which you can then segment by campaign, traffic source, etc.
Cool New Feature #8: Use data integrity filters!
OK, I admit data filters are neither cool nor new. However, you should be using them! A series of very simple filters can go a long way toward helping you keep your data clean. Here’s the issue: Google Analytics never does you any favors in terms of keeping your sources, mediums, campaigns, URLs, etc., clean for you. Minor differences like capitalization cause Google to report entirely different line-items in your reports. For example, if you tag your email blast this month with a medium of “email,” but you tag your email blast next month with a medium of “Email,” you’ve now got two completely separate mediums. Using lowercase filters can help you avoid this entirely – whether for mediums, sources, campaigns, URLs, hostnames, keywords, or anything else. Here’s how to create a basic lowercase filter.
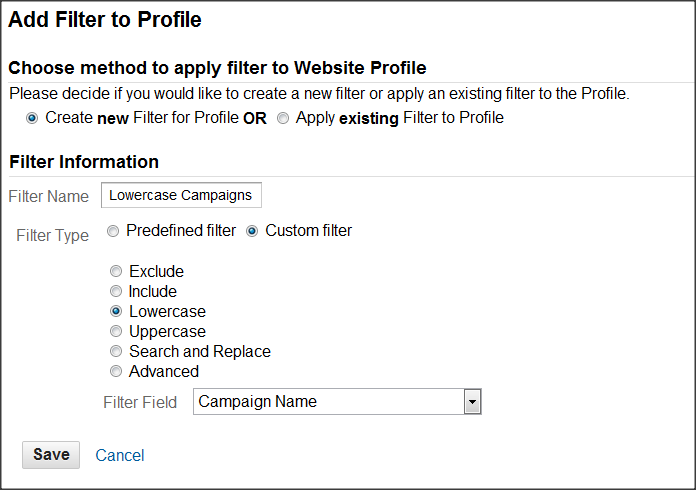
Not so hard, right? You can replicate this for keywords, sources, mediums, and more, as I mentioned above. Applying these filters will ensure that you never have to deal with messy, inconsistent data due to human error, campaign tagging mistakes, etc.
Other data filters can be really helpful, too. Don’t forget to exclude your internal IP addresses and ranges from your data as well, for example.
That’s it for now! Using the 8 features I’ve covered over the last two days should help you take your analytics game to the next level. If you think I’ve missed anything, let me know in the comments! Lastly, keep up with all of our tips & tricks by following us on Twitter.


