down-is-up
Recently, an issue came to light with one of our clients which turned our world upside down – quite literally.

In the graph (shown below), Unique Pageviews vs. Pageviews was compared for a given date range for a select group of pages.
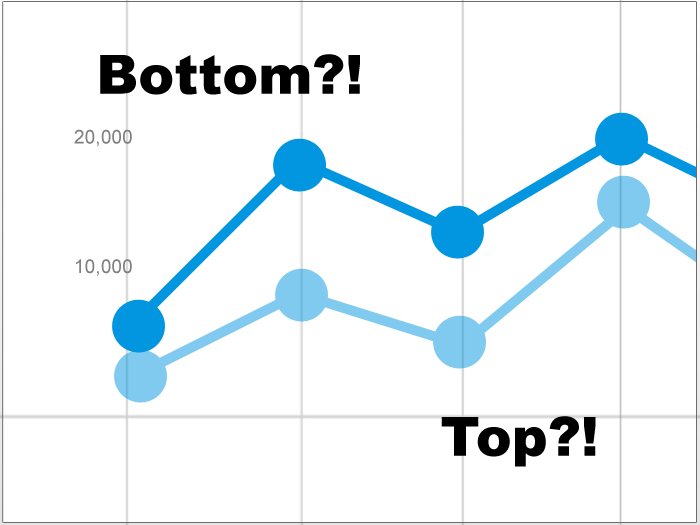
If you click on the image to zoom in, you’ll notice something weird. For some reason, the line of the Pageviews metric — which is higher in number — is lower visually than the unique pageviews.

What the @#$^ is happening?

pageviews-higher-than-unique-pageviews

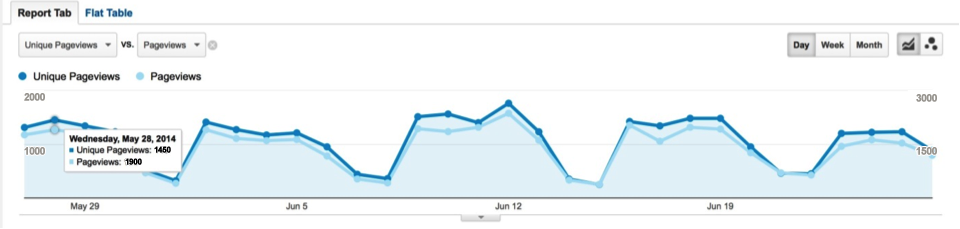
The unique pageviews line (the higher of the lines) is graphed according to the y-axis scale on the left. What you probably didn’t notice is the pageviews line (the lower of the two lines) is graphed according to the secondary y-axis on the right. Yes, there is another y-axis on the right side.

Because the scales are different, they’re spatially and visually apples and oranges in terms of height.It’s a bit counter-intuitive and weird, but we thought we’d share this finding with you in case any runs into this issue and get’s confused.

Still confused? That’s ok. At least you know why now 🙂

Message Sent

Thank you for registering.

Cardinal Path hosted a live session to connect with you and answer all your questions on Google Analytics.
Get all the expertise and none of the consultancy fees in this not-to-be-missed, rapid-fire virtual event.

Thank you for submitting the form.

Thank you for submitting the form.

Message Sent

Thank you for registering.

Message Sent

Thank you for registering.

Message Sent

Thank you for registering.

Message Sent

Thank you for registering.

Message Sent

Thank you for registering.

Message Sent

Thank you for registering.

Message Sent

Thank you for registering.

Message Sent

Thank you for registering.

Message Sent

Thank you.

Click here to download access the tool.

Message Sent

Thank you for registering.

Message Sent

Thank you.

Message Sent

Thank you.

Message Sent

Thank you

Message Sent

Thank you

Message Sent

Thank you.

Message Sent

Thank you

Message Sent

Thank you.

Message Sent

Success!
Your message was received.

Thank you.

Thank you for registering.

Cardinal Path is continuing with its series of free training. Next we are conducting training on Google Data Studio. Check it out here.

Message Sent

Thank you for registering.

Thank you for your submission.

Your request has been submitted and a rep will reach out to you shortly.

Message Sent

Thank you for your interest.

Thank you for registering.

You should receive a confirmation email from GoToWebinar with your unique webinar login information. If you do not receive this email or have trouble logging in to the event, please email asmaa.mourad@cardinalpath.com.

Thank you for subscribing!

You're now looped into the world's largest GMP resource hub!

Thank you for your submission.

Thank you for your submission.

Thank you for your submission.

Thank you for your submission.

Message Sent

Thank you for registering.

Message Sent

Thank you for your submission.

Thank you for your submission.

Message Sent

Thank you for registering.

Thank you for registering.​

Paid media spend by Government websites increased a whopping 139% YoY in 2020.

2020 Online Behavior Live Dashboard

Message Sent

Thank you for registering.

Message Sent

Thank you for registering.

Message Sent

Thank you for registering.

2020 Online Behavior Live Dashboard

Thank you for your submission.

Message Sent

Thank you for registering.

Message Sent

Thank you for registering.

Message Sent

Thank you for registering.

Message Sent

Thank you for registering.

Message Sent

Success! Thank you
for reaching out.