
In this post, we’ll examine the following aspects of attribution.
- What is attribution modeling?
- Why single touchpoint attribution inherently wrong if you have a multi-channel marketing program
- Why it is crucial to track all of your marketing initiatives as accurately and comprehensively as possible
- How different attribution models embody different perspectives on marketing value
- Practical steps to begin using attribution models to test channel-mix optimization
What is Attribution Modeling?
Just in case there’s still some confusion about what conversion attribution and attribution modeling is, here is a brief explanation of each:
Attribution: how credit is given to marketing activities for generating conversion activities (micro-conversions, leads, acquisitions, transactions).
Attribution Modeling: The science and art of developing and comparing different schemas for attributing conversion events to contributing marketing activities. In most cases, attribution modeling is an attempt at creating a more realistic picture of the conversion value being generated by multi-channel marketing efforts when a significant share of conversion activities has two or more measurable touchpoints.
Not All Models Are Created Equal
For over a decade, attribution has largely been a single-interaction attribution universe, mostly by default. The built-in conversion tracking features of Google AdWords, Bing, Google Analytics, and various other tools used variations of last-click attribution for several years before introducing other attribution models. Over the years, I have had clients using a variety of homegrown tracking systems, and even this reporting relied largely on single-touchpoint attribution models, either first- or last-click. Adobe SiteCatalyst’s default campaign reporting was historically based on last-touch or first-touch attribution reporting as well.
Marketing & Analytics Technology Enables Better Attribution Reporting
Over the past five years, our reporting toolsets have quickly become much more sophisticated and more powerful in how we can attribute conversion activities to our marketing efforts. It is no longer advisable to stick with default single-touchpoint attribution because the ability to see a more realistic picture of how your marketing initiatives drive value is greater than ever. Let’s start with two assumptions and then dive a little deeper into attribution.
Assumption 1: Multi-Channel Marketing
For attribution modeling to offer interesting insights, I assume your marketing program is multi-channel, involving at least two significant kinds of initiatives (Paid Search, Local Search, Display, Video, Social Media, SEO, Email Marketing, Content Marketing, TV, Radio, Print)
Assumption 2: Accurate & Comprehensive Tracking
I also assume you are tracking everything that can be tracked as accurately as possible (through campaign parameters and autotagging options available in AdWords, DoubleClick Campaign Manager, and Bing Ads). If you are spending advertising dollars on a promotion, it should be tracked. If you are spending your staff’s hours on an initiative, it should be tracked. If it drives traffic to your website and/or business locations, it should be tracked to the greatest extent possible.
If assumption 1 is true for your organization and you are still using single-interaction attribution models (i.e. First- or Last-Click), then you have an attribution problem by definition. Taking a fairly extreme example for a ninety-day period, this real client example helps prove the point well. With nearly 80,000 conversions and over $130 million in revenue, only 22% of that conversion value was for transactions with a single point conversion path. Almost 80% of all transaction value involves two or more marketing channel interactions, and 49% of the conversion value was for transactions with 12 or more points in the conversion path.
Conversion Path Length Related to Attribution
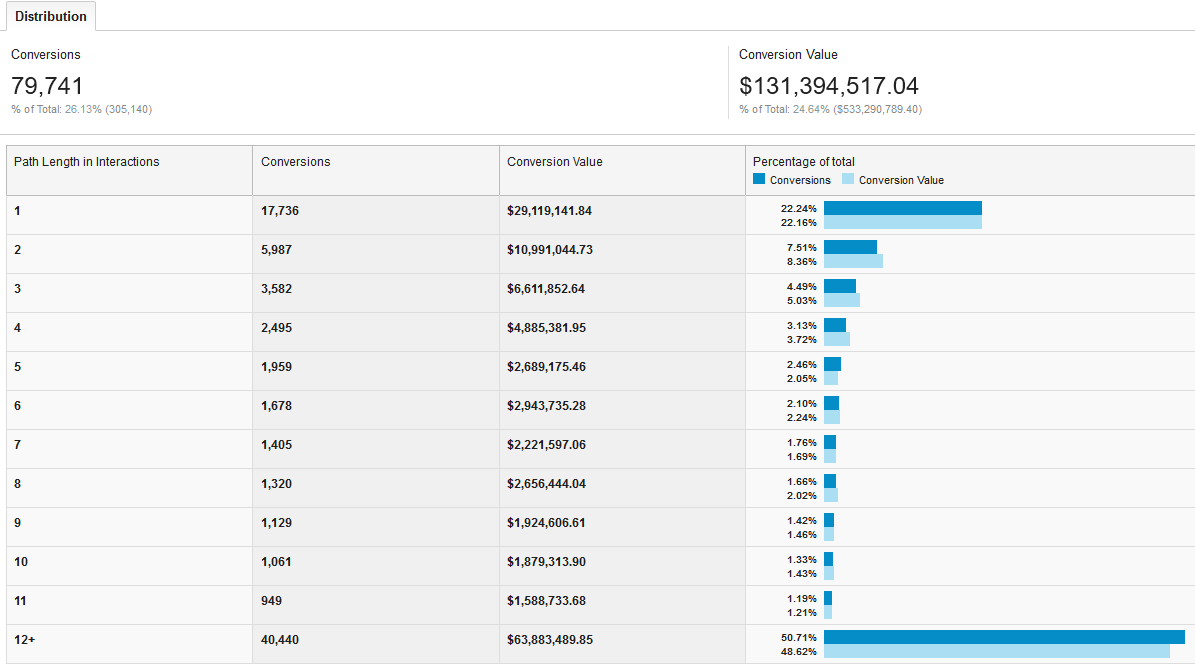
The Multi-Channel Funnels > Path Length report in Google Analytics demonstrates that nearly 78% of conversions did not occur on the first session.
If assumption 2 is true for your organization, you have already done a lot of the legwork necessary to employ more sophisticated attribution modeling in your reporting, optimization, and channel-mix analysis. However, never assume you are doing everything necessary to track your marketing activities. Prove it, audit your tracking, and make sure this is the case. And once you have done that, realize that you are still only seeing part of the picture. Your TV, radio, and print tracking using vanity URLs or other efforts will still be incomplete at best.
Are you uploading your offline conversion activities into your analytics or BI platforms, too? If not, you have an incomplete picture of the value your efforts are driving. Did you know you can upload your media costs into Google Analytics, too? That’s right, you can do a much better job comparing value and ROAS of your channel-mix if you have a more complete picture of both your ad spend and your conversions/transactions.
Start Looking at New Attribution Models for Your Data
You have multi-channel marketing program, so you know first and last click attribution are wrong. So, is multi-touchpoint attribution modeling right? Unfortunately, not, but it is really a matter of degrees. As Avinash Kaushik has pointed out, there are no perfect attribution models. Some are better than others because they inherently reflect more closely what you already know to be true about your marketing program and the various ways that users and customers interact with your company. A model that inherently reflects what your data is already telling you is much better than one that inherently ignores it.
What are your options? Take one small step in the right direction. Start looking at the following attribution models in comparison to Google Analytics default last non-direct click model: Time Decay, Position Based, and Linear models. Each model represents a different perspective on what drives conversion value. Even these other models are far from a perfect description of reality. However, they are a much better approximation.
Time Decay: gives conversion credit to all interactions in the conversion path, but it gives a disproportionate amount of credit to the most recent interactions. The default half-life is 7 days, so an interaction that happened 7 days ago receives ½ the credit of one that happened today.
Position Based: gives equal credit to the first and last interactions and then divides a smaller amount of credit among the intermediate interactions. 40% of conversion credit goes to first interaction, 40% to last interaction, and 20% is evenly distributed to the intermediate interactions.
Linear: Equal credit is given to all interactions in the conversion path.
Using the same client data we looked at above, an attribution model comparison gives you some idea of why the perspective of an attribution model is so important:
Attribution Models Determine How You Allocate Conversion Value
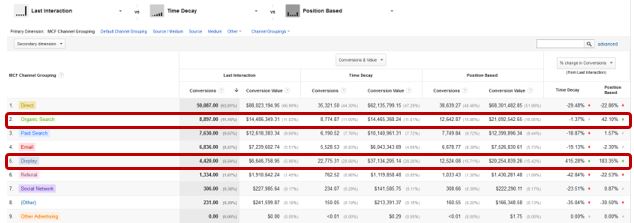
When we display the Time Decay and Position Based models in the Model Comparison Tool, we see that the Organic Search and Display channels are undervalued in the default Last Interaction model.
Again, assuming you are tracking everything as accurately as possible, this attribution comparison points out two very obvious perspectival differences. For example, Position Based attribution offers a bookend perspective. The first and the last click are the heroes, and they get the most credit. Okay, but how does that play out? If that perspective is correct, you can see that Organic Search efforts are vastly undervalued by a last-click model. In fact, when first and last click are the heroes, Organic Search receives credit for 30% more revenue: a $7,000,000 increase. The Time Decay perspective asks, “What have you done for me lately?” This perspective says that an interaction that happened today is more valuable than one that happened yesterday. From this perspective, Display advertising is undervalued immensely from a last-click perspective. Time Decay says Display is responsible for $31 million more in revenue than you are giving this channel credit if your just go with default reporting. That’s a pretty stunning shift in value.
Putting Attribution into Practice: Test & Measure
We know that multi-interaction attribution is better than single-touchpoint attribution. We also know that even multi-interaction models are not perfect, so how can you put attribution models to practical use for your company?
We know that multi-interaction attribution is better than single-touchpoint attribution. We also know that even multi-interaction models are not perfect, so how can you put attribution models to practical use for your company?
- Start testing: in the example data above, both Organic Search and Display were significantly undervalued by the default Last-Interaction model. Do an experiment. Take the perspective of the Position Based model as a working hypothesis. Accept the increased conversion value for Display as given, and come up with a channel mix that reflects this contribution from Display. Put some additional Display test budget into play, and measure the results. How will you know if your test was a success? Let’s assume you have an overall blended marketing budget of $100,000/month and you generate 5,000 transactions per month with this budget. Let’s also assume this is a relatively stable level of performance for you.
- You have a $20 cost per conversion as a baseline
- If you devise a new channel-mix and your hypothesis is correct, you should see an improvement in efficiency for your efforts. That same $100,000 spend should produce a different set of results if you make a significant change to your marketing mix.
- Let’s assume that now you get 5,500 transactions for the same spend. You’ve improved your effectiveness by 10% and reduced your cost per conversion to just over $18.
- Note of caution: remember that you are just getting started and that what you are testing are hypotheses. It is not out of the realm of possibility that your hypothesis will provide to be false. If your test proves to be less effective, reset to your baseline and start testing a new hypothesis. This is why it’s called testing: you don’t know the outcome. It is also a good reason to always maintain an incremental testing budget that does not put your proven marketing initiative budget at risk.
- Based on your test results, customize your attribution model, as demonstrated in the procedure below. Any of the default attribution models in Google Analytics can be copied and customized to fine-tune your attribution. A great example of a custom model is Avinash Kaushik’s Market Motive Mindblowing Model (yes, the name is a bit tongue-in-cheek, but the model is very good). His model is a variation on a position-based theme, but he refines the model to reflect a few different assumptions. In this case, the model gives big credit to the last click, the closer (40%) and a much smaller share to the first click, the introducer (10%), and then a significant share (50%) is divided evenly among the intermediate steps. An inherent assumption here is that all of those intermediate touchpoints that help keep you top of mind and that can provide sequential messaging, remarketing, and other nurturing communications are all really important after all. He has also adjusted the lookback window to 75 days, adjusts credit proportionately based on user engagement defined by Page Depth, and applies a custom rule to give 1.4X credit to click interactions compared to other interaction types (impressions).
Based on your industry, customer profile, and product lines, and whether you are tracking conversion activities such as lead generation or sales transactions, one particular adjustment to be mindful of is the lookback window for conversion attribution. If 95% of your conversions happen within 45 days of first touch, then you probably don’t want to max out your lookback window to 90 days (or even 75). Doing so will in all likelihood attribute an unrealistic amount of conversion credit to interactions well outside your typical customer’s consideration window. At least as a starting point (unless you truly believe your current customers do not reflect the nature of your business), try to set your lookback window close to the maximum conversion time that includes 90-95% of your conversion activity.
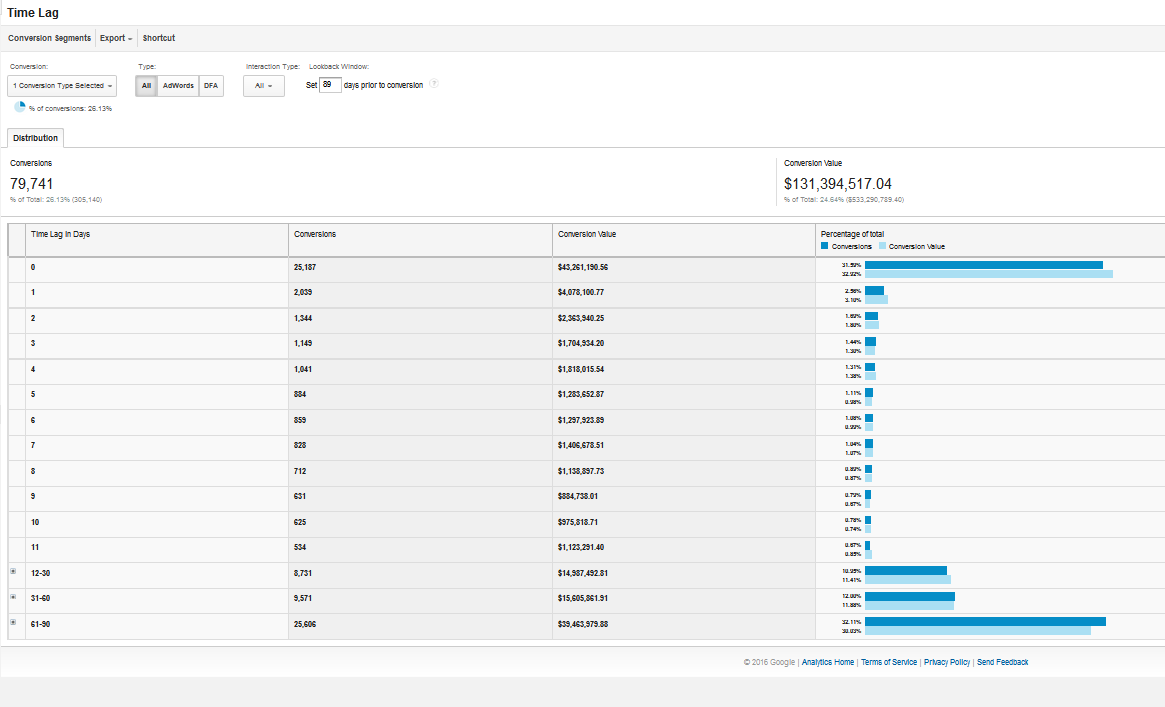
Use the Time Lag report to find the maximum time lag that corresponds to 90-95% of your conversions. This is a good starting point for your lookback window configuration.
- Test again: Now take the Time Decay model’s conclusions as a starting point. Looks like you have been severely undervaluing your SEO/Content Marketing efforts. Can you invest more heavily in SEO efforts? Can you generate impact quickly enough to have an impact? If so, run a 90-day test, and see if the results correspond to the model. Increasing your organic traffic should always be a priority, but in this case the Time Decay model is showing you that this traffic is considerably more valuable than you originally thought. If you can increase your organic search footprint and bring in more traffic from this channel, measure the impact on your overall marketing effectiveness after that 90-day time period. Be sure to also measure the investment in time and resources to optimize pages and to research and produce quality content for your site. While content production is always a wise marketing decision (as long as it is unique, high quality, and valuable to end-users), stepping up your SEO efforts will not qualify as a test unless you carefully measure the impact.
- Based on your test results, customize again.
Creating Custom Attribution Models in Google Analytics
Step 1: Access Model Comparison under the Attribution Sub-Section of Conversions
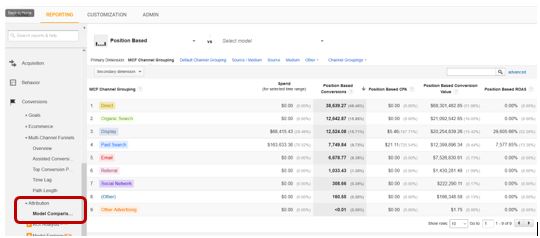
Step 2: Choose a default model to customize and click ‘copy’ icon

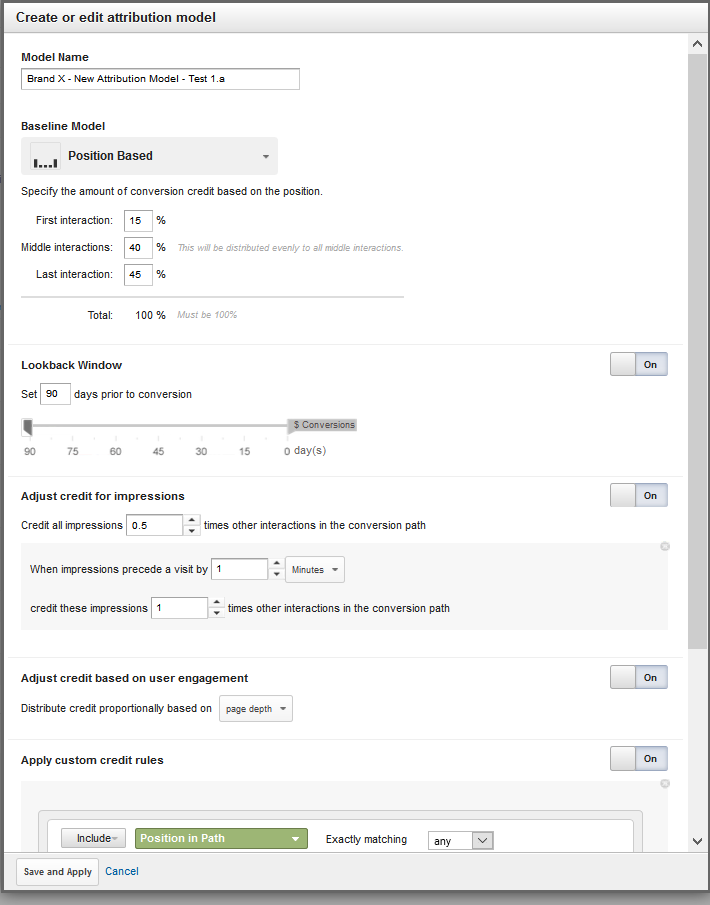
Step 3: Customize rules for assigning value to conversion path interactions
Take one step at a time. Ensure your tracking is as good as possible within your tracking limitations. Start using some better models for giving conversion credit. Apply those models to your marketing investments/channel-mix, and test the results. Keep testing, and keep refining your model to better reflect your business objectives and your customer behaviors.


