 “I…i…i…i… I’m soooo in love with you… whatever you waaaant to dooo… it’s alright with meeeee…!” – lyrics from the “Reverend of Soul” himself – Al Green.
It’s Valentine’s Day, love is in the air! So, we thought we’d shoot cupid’s arrow through this next post about data and measurement. Give it some “love”, so to speak.
If you’re heavy into Google Analytics, you might be “infatuated” with quantitative data – “views”, “visits”, “bounces”, etc. – and…ahem…”RAW” numbers. That’s only one “better half” though. That is, it’ll tell you “what” is happening on your site. However, what about the other half – “why”??? One way to answer that question is by “marrying” your quantitative analytics data with qualitative, “voice-of-customer” survey data.
“Why… why do people break up? Then turn around and make up… I just can’t seeeeeeee….”
Let’s take a statistic of love. Unfortunately, it looks like approximately 50% of marriages fail 🙁 [Cupid, what the hec are you shooting at?] The Reverend of Soul, Al Green stated in his immortal lyrics, that he could see “what” was happening, but for the life of him, just couldn’t see “why” people break up!!!
This Valentine’s Day, let’s pretend to try to solve this urgent matter of the heart. WHY is this happening?! Is the aforementioned statistic enough for you to take action? Doesn’t look like it.
Those of you who’ve been through a tough time in your relationship know it’s not black and white – there could be a plethora of reasons:
- You might have grown apart
- Stresses like money could have strained the relationship
- Infidelity
- Communication could be missing
- Etc.
As any counselor would tell you, they wouldn’t just diagnose “what” is going on in a couple’s troubled relationship, then right away present solutions. In order to solve the issues, they would go into several deep counseling sessions so they can get to the nitty gritty of “why” this is happening.
Similarly, diagnosing “what” the issues are with your website is only part of the process. Voice-Of-Customer qualitative surveys could potentially give you insight into “why”, insight that may not be readily apparent from quantitative data.
“Let’s Stay Together” – Putting Voice-Of-Customer Together with Quantitative Data
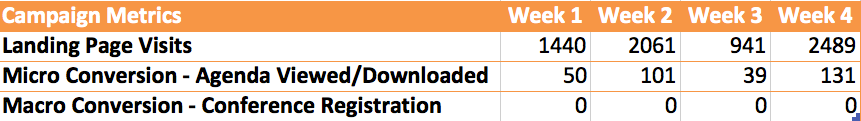
You have several ad campaigns leading visitors to a landing page asking them to register for your event. As the example figure below indicates, your analytics may be telling you that your landing page is getting all the traffic you’re paying for, from Facebook/Google Adwords campaigns, etc. You’re spending good money, and your micro conversion, say an agenda for your event, is getting all the downloads you want. But according to your data, the bounce rate is really high and no one is registering for your conference. Why?!
We recently ran into a similar situation with a project our consultants were assessing, and tried to figure out the issue:
- Was there not enough sales information? We listed all the bullet points…
- Did clients not trust the organization/service? We listed impressive certifications and testimonials…
- Was the registration call-to-action button not clear enough? It’s big and yellow, and it looks like people are clicking on it according to our data…Just not completing registration
At this point, even if you had all the unsampled data in the world from Google Analytics Premium, you’d still be stuck. There’s always an option of implementing A/B testing, but that would take time and coding. Plus, what do you start testing? You can make educated guesses, but you’re pretty much taking shots in the dark (like cupid).
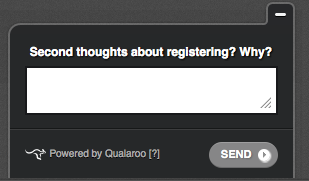
So even before we explored A/B testing, we tried implementing Qualaroo – an awesome, quick, non-invasive survey that quietly pops up based on criteria you set (ex. 30 seconds on the page, after 2 pages have been visited, etc.). You can ask any question – open-ended, multiple-choice, etc. And after each survey is complete, get reports in the native interface or download reports into .xls for deeper crunching.
So we asked – “Second thoughts about registering? Why?”
Sample responses were as follows:
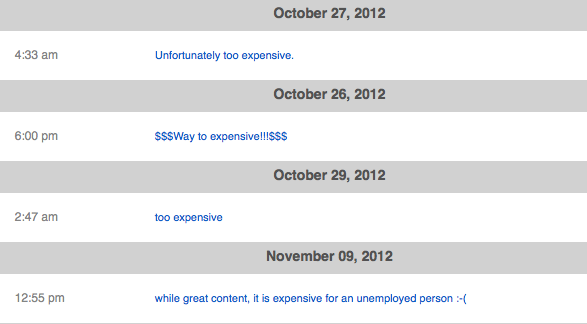
As you can see from the responses (after ensuring we had enough replies for an acceptable confidence level/ statistical significance…), it was pretty much unanimous – pricing was the issue!
It would have been extremely hard to conclude that with just the quantitative data. We may have stumbled upon this after some A/B testing, however, after marrying the qualitative, it pointed us towards a pretty reliable direction in a quick and efficient manner. Even if we wanted to verify using A/B testing, we now have an idea of where to start.
They lowered the pricing and registrations started rolling in!
Conclusion
So when you’re having dinner by candlelight tonight, gazing into your lover’s eyes… slowly move in close, and whisper ever so gently… “My quantitative is incomplete without your qualitative…” <3


