Update 1/23/2012 – As the commenters have pointed out you will need to delete the analytics.dat file from the program download in order to authenticate successfully. Will update blog post/files soon.
Update 1/24/2012 – Link to github – https://github.com/CharlesFarina/Google-Analytics-Cost-Data-Upload–Python-
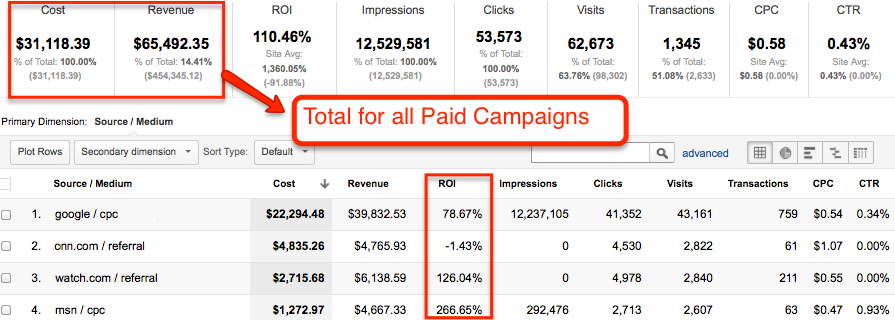
As the year closes, I wanted to make you aware of a feature in Google Analytics that has amazing potential. This will tie in with all of your New Year resolutions around making better marketing decisions. In October at the Google Analytics Certified Partner Summit we attended, Google announced the new cost data upload feature. For the first time we can measure the return on investment for all of our paid advertising campaigns. You can segment and dive into this data to find what aspects of each paid traffic source or the overall campaign are under or over performing and optimize accordingly. This feature allows you to upload non-AdWords cost data for Bing, Facebook, LinkedIn and any of your other paid traffic sources. What we are trying to create is the report below:
You can now make decisions on your marketing campaigns based on ROI inside of Google Analytics! It is very apparent in the above report that we need to reevaluate or do optimization for the cnn.com campaign, since we are making less than what we are spending with an ROI of -1.43%. This is the type of insight I want to help you find.
Use This Program or an API?
The first thing you should do is check to see whether the traffic source you want to upload cost data from has an API. Many popular services like Facebook and Bing have an API that you can leverage to save you a significant amount of time and effort. E-Nor has leveraged this with many of our clients like OEMPCWorld. If your source has an API, you can use a tool like ShufflePoint In2GA and work with them to establish the connection. This connection will upload all of your historical cost data as well as upload your new cost data each day. This means you don’t have to do anything on your end outside of creating/paying for an account with ShufflePoint.
It is very likely that you will also have sources that don’t have an API. This could be affiliate networks, banner ads, e-mail lists, and the like. You could also decide you don’t want to pay someone to establish an API connection, so the following instructions could apply to Facebook and Bing as well. The instructions below will allow you to upload cost data from any .csv files on a Mac to Google Analytics. These files can be created in Microsoft Excel, Google Docs, iWork, or any of your favorite spreadsheet tools. I tried to make these as detailed and easy to understand as I could, so that anyone could use it. The best part about this tool is that it is free and will be a great way to end the year or kick off the new year with new insights.
Disclaimer: These instructions are for Mac only. If you are familiar with programming languages, getting it to work on Windows shouldn’t be difficult. I can also not be responsible if anything breaks or your computer explodes, this is a free tool after all =)
Here are the six steps:
1. Create Project and Obtain OAuth 2.0 Client ID
a. Go to Google API’s page and click the blue “Create project…” button
b. Slide “Analytics API” to On
c. Agree to the terms of service
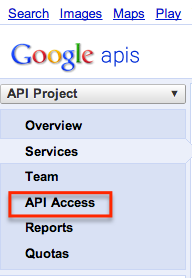
d. Click on “API Access” in the left navigation
e. Click the blue “Create an OAuth 2.0 client ID…” button
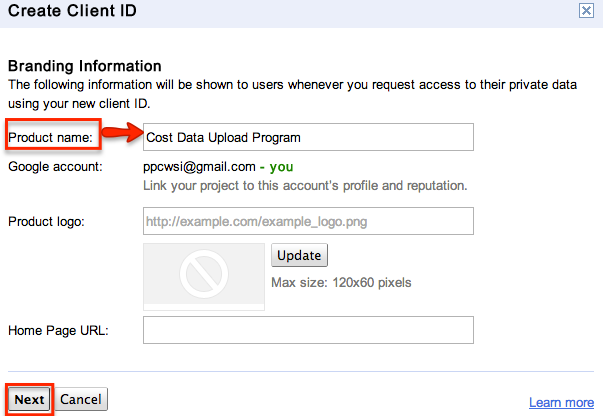
f. Fill in “Product name” field with “Cost Data Upload Program”. Leave rest of form blank and click grey “Next” button.
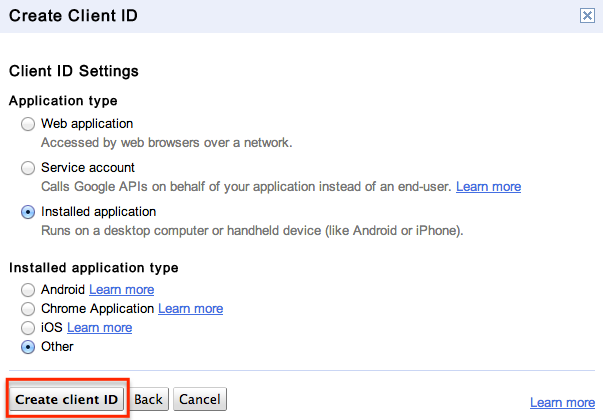
g. For Application Type select “Installed application” radio button. Leave installed application type defaulted to “Other.” Click grey “Create client ID” button.
h. Find and click the “Download JSON” link in the Client ID for installed applications section on the right side of page
2. Download and Install Cost Data Program
a. Place the downloaded “clients_secrets.json” file from step 1h on your desktop.
b. Download the “e-nor cost data upload program” to your desktop. Select file then download to download entire zip, instead of each file individually.
c. Unzip the download and make sure it is on your desktop.
d. Drag the “clients_secrets.json” file (step 1h and 2a) from your desktop into the unzipped “e-nor_costdataupload” folder (step 10-11) on your desktop. Select “Replace” when prompted.
e. Login to Google Analytics and go to the profile you want to upload data to
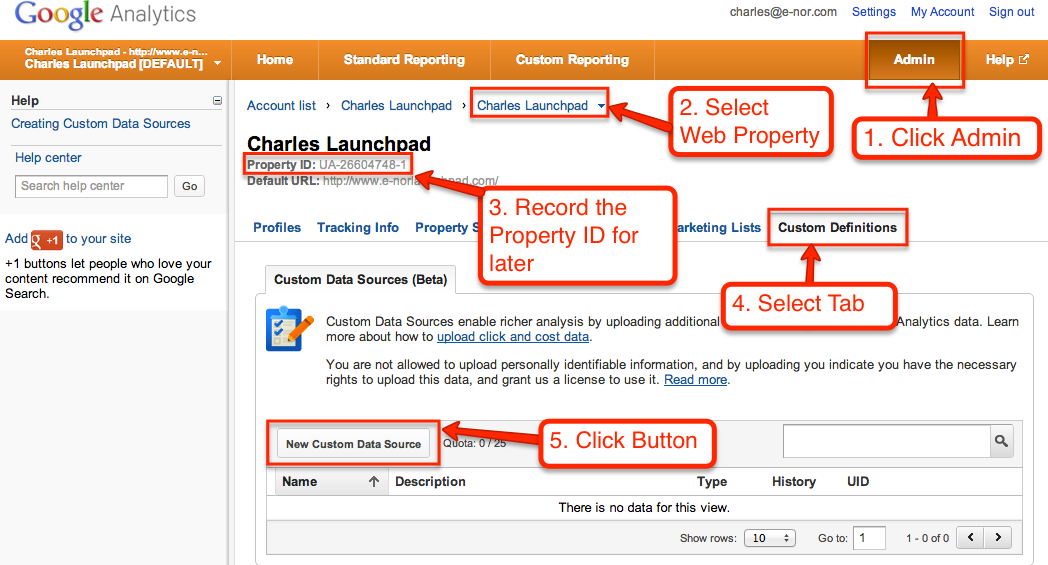
f. Click “Admin” Button in top-righthand corner
g. Record the provided Property ID: UA-XXXXX-XX
h. Click “Custom Definitions” Tab
i. Click “New Custom Data Sources (Beta)” Button
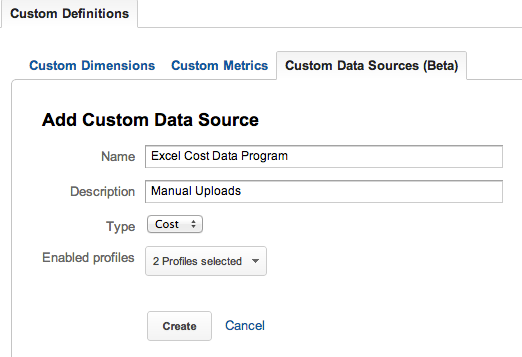
j. Enter a name, description and select profiles to send data to and click “create”
k. Record the UID
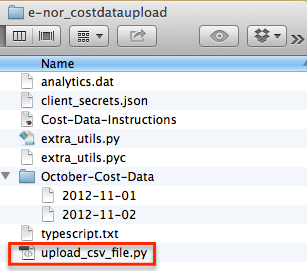
l. Open the “e-nor_costdataupload” folder and open the “upload_csv_file.py” file
m. Scroll to the bottom and replace the accountId, webPropertyId and CustomDataSourceID with what you recorded in steps 2g and 2k. The accountId is the same as the webPropertyId, just with the beginning and end removed. If you recorded UA-123456-1 in steps 2g. You will put UA-123456-1 as the webPropertyId and 123456 as the accountId.
n. Save and close the files
3. Installing Google Analytics API files through Easy Install
a. Download the Easy Install files here and place file on desktop
b. Click spotlight in top right hand corner of your Mac and type in “Terminal” and open it.
c. In Terminal type or paste: cd Desktop
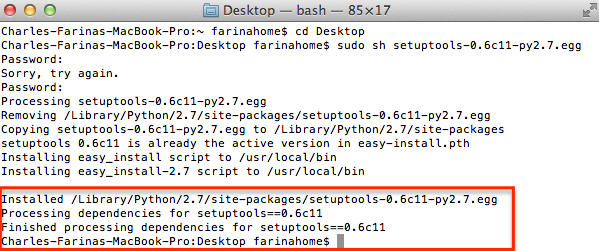
d. Type or paste: sudo sh setuptools-0.6c11-py2.7.egg
e. Enter your password and you should see the below message if successful
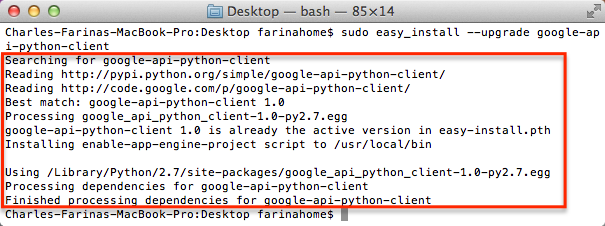
f. In terminal type or paste: sudo easy_install –upgrade google-api-python-client
g. If successful you will see this message
4. Creating Cost Data Files
There are 17 different dimensions and metrics you can upload, but only 5 are required: cost, impressions, clicks, source and medium. In the e-nor_costdataupload/October-Cost-Data folder you can find examples of the fields and formatting that is required or view the image below.
5. Uploading Cost Data
You will now be uploading a cost data file. You need to first create and save the file as explained in step 4. We will now upload one day of data using the following command: ./upload_csv_file.py {yyyy-mm-dd} ~{cost-file-location}
If we are trying to upload the example files included with the program we would enter the following in terminal:
a. Open Terminal and type or paste: cd Desktop/e-nor_costdataupload
b. ./upload_csv_file.py 2012-11-01 ~/Desktop/e-nor_costdataupload/October-Cost-Data/2012-11-01.csv
6. Viewing Cost Data in Google Analytics
This is the hardest part of all! You will need to be patient and wait for up to 12 hours to see the cost data appear in Google Analytics. In my experience on average it took about 30 minutes. You will find it in the Traffic Sources Section as “Cost Analysis”. You can also create custom reports to add in metrics such as revenue, transaction and to apply various advanced segments or filters.
Closing Thoughts
I love this new feature, but as you can tell if you aren’t leveraging an API tool it can be quite a bit of work to get the data into Google Analytics. Two improvements I have planned are first to have a way to batch upload buckets of files at one time and also for a script in Excel to create multiple files from a master spreadsheet based on date. Ideally, I would like to be able to create one spreadsheet with all of the dates/data I need and have the program parse and upload it from memory. The source code for the program is given to you, so I encourage one of you to do it and let me test it =)
Related Posts:
