Are my tags firing? Is this data correct? A large part of what I do for Cardinal Path is dissecting a websites’ inner workings to ensure its web analytics implementation is collecting properly. Diving into the world of web analytics forces you down the web development path. Whether you go willingly or kicking and screaming, there are a handful of tools you can arm yourself with to aid in your journey to the perfect implementation. There are many plugins, applications, extensions, and everything in between to help you diagnose issues with your implementation, but these are my top picks for quick and easy answers to hard questions.
Google Chrome Developer Tools
Chrome’s developer console is an invaluable tool for peering into the inner workings of your site and implementation. You can quickly and easily pull up class information by right-clicking any element of the site and inspecting that element from the drop down. The console allows you to fire off javascript code to see how the site responds. If you use another browser, ensure you use Google Chrome for your troubleshooting activities.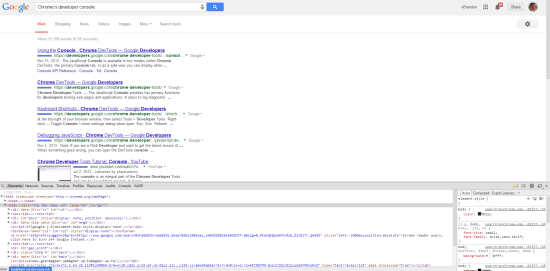
Web Analytics Solution Profiler (WASP)
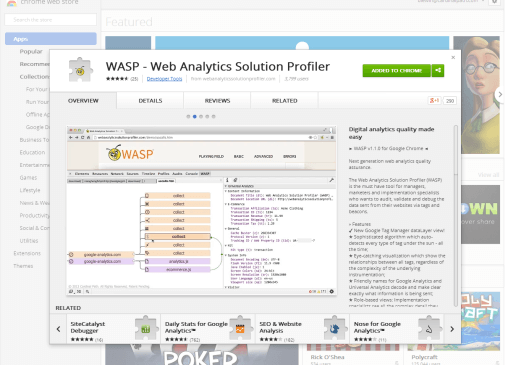
What GA Debugger lacks in visual and technical detail, WASP makes up for in spades. WASP is the Cadillac of debugging tools. I may be a bit biased since this is a Cardinal Path tool, but without my affiliation to Cardinal Path, I would still use this tool daily. WASP gives you a wonderful visual representation of the tags firing on your site and the correlation between them. Clicking any of the tags provides deep technical insight into what’s happening behind the curtain. WASP’s newest functionality allows you to peer into the GTM data layer which eases the burden of troubleshooting the increasingly common Google Tag Manager and Universal Analytics implementations. Lastly, WASP is platform agnostic so it will give the same transparency for Omniture, SiteCatalyst, DoubleClick, and any other platforms you may be implementing.
Real Time Reports
Many people leverage real-time reports for quick insight into how their site is performing right now. While this is the primary function of these reports, the majority of time I spend looking at real-time activity is during testing to ensure GA is receiving the data the site is sending. There is a send and receive relationship between your website and Google Analytics servers, and being able to put eyes on both ends of the transaction is a great way to see if your data is being received, not just being sent. Bear in mind when viewing these reports they are affected by your view filters.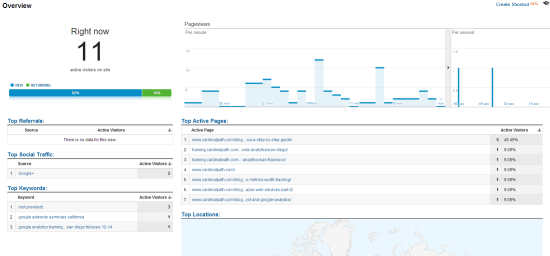
Ghostery
Ghostery is a plugin compatible with multiple browsers that gives you the most basic information. When you land on a website, a little floating purple box appears in the top right hand corner of your window, displaying a list of the analytics tags that are firing. It’s very simple. You also have the option to disable calls to particular services on the list if you so choose. If you’re a layman when it comes to web development, this would be the best place to start.
Google Analytics Tag Assistant
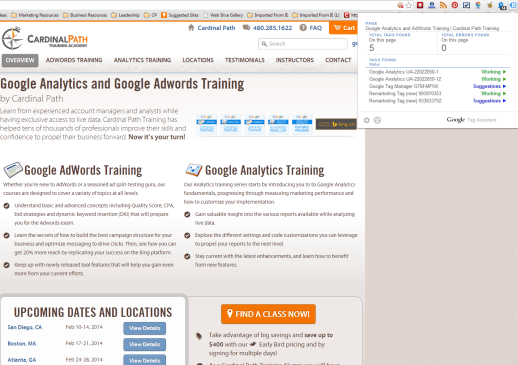
Google Analytics Tag Assistant is slightly more robust than Ghostery. This neat little plugin gives you a simple readout of which GA tags are firing on your site, what UID those tags are reporting to, and finally some boilerplate recommendations and suggestions. I find more advanced implementations receive some strange suggestions and/or items marked as critical issues, so understand the Tag Assistant is giving you general best practice recommendations. The advice is always sound, but it is case-by-case on whether it applies to you or not. What I really like about this plugin is that it looks at where the code is located and what version it is, not just the calls to Google. This is also a great way to find the GTM or GA account associated with the site you are debugging.
Google Analytics Toolbar Debugger
This plugin is a little more advanced but it dives deeper into the data being sent to Google. Enabling this plugin will result in a wealth of output information for the console in Chrome’s developer tools. You will be able to see everything from your source, medium, and keywords to the details of events, page views, or virtual page views. Quite literally every dimension and metric being passed to Google is laid out for you in the console. As detailed as this information is, if you understand the reporting aspects you’ll understand the output in the console. No need to shy away from using this if you’re not a developer.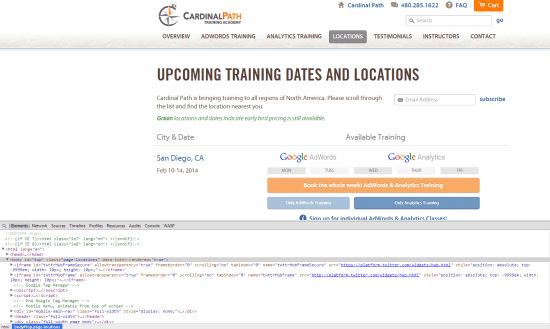
Honorable Mention: Fiddler
Fiddler receives honorable mention for the simple reason that it’s quite advanced. That’s not a bad thing, it’s pretty great but this list is for the quick and easy. Some aforementioned items such as GA Debugger and WASP allow for some very technical scrutiny, however, they do have a quick-to-pick-up surface value that anyone can use. Fiddler allows you to peer into outbound traffic generated from your browsing activity and even hijack the activity with your own testing data if you so choose. This is valuable for GA implementations when page transitions are quick and you need something to capture that data instead of just report on it.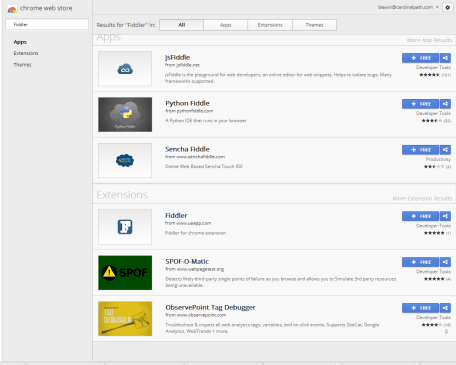
What sort of tools make up your implementation toolbox?


