Bill Gates once said,
“The most meaningful way to differentiate your company from your competitors, the best way to put distance between you and the crowd is to do an outstanding job with information. How you gather, manage and use information will determine whether you win or lose.”
With the announcement of
Wave, SalesForce Analytics Cloud, it’s now more important than ever to measure clients’ 360 journey to connect the dots between business user data (e.g. sales data in SalesForce) and web and mobile behavioral data (e.g. user interactions data in Google Analytics). In this post, we’re going to show you how to do that!
Our Story
To improve profitability, every company (regardless of size) requires multiple tools to understand their customers and potential customers. In our organization, we use Google Analytics to improve the effectiveness of our web and mobile presence as well as to track and understand the behavior of our online visitors and how they interact with our digital properties (Website, Mobile App, YouTube Channel, Facebook page, Twitter Profile,…). When our (online) visitors convert to leads, we rely on our CRM platform, SalesForce, to track the history of our prospects’ and customers’ offline and online interactions. We track every single conversation possible – from emails, calls, meetings, and documentation. While Google Analytics itself gives us the ability to measure the effectiveness of our marketing campaigns in terms of what channels bring visitors to our “front door”, we were missing the link between real live sales conversions and the original (online) lead generation/traffic sources. Our sales team receives a flood of leads and sales, talking to many prospects and meeting with many customers. We need to link the valuable information they gather with what brought these leads to us in the first place. This missing link led us for many years to inaccurate conversion attribution, bad budget allocation, and incorrect strategic business focus.
Corrective Action
In order to make better-informed decisions on marketing, budget allocation, and strategy, we need to have clear visibility into the sales cycle not only from the point of live contact, but from the possible origin of online inquiry. To do that, we integrated the two tools that tell us this (SalesForce and Google Analytics) in the following way:
- Pass as much relevant Google Analytics visitor behavioral information as possible to SaleForce with every form submission
- Pass the final lead status and offline activities from SalesForce back to GA.
Technical Challenge: New integration method with Universal Analytics
Marrying data from different sources is nothing new. But when marriage gets a little stale, sometimes you have to find new ways to spice it up! 🙂 Our legacy solutions were heavily dependent on the Google Analytics
_utm cookies that are generated by the classic
ga.js tracking code, in which session and campaign information are stored in the tracking cookies. In the new Universal Google Analytics, all tracking happens at the server-side level and the single
_ga cookie generated by the new
analytics.js does not contain any session or campaign information.
Solution
We adjusted our
classic integration method with a solution that works with all GA tracking code versions, including the latest version of Universal Google Analytics tracking code. All needed code was bundled in one JavaScript file called GASalesforce.js
Passing GA data to SalesForce
By following the steps below, you’ll be able to pass users’ campaign and session information into SalesForce every time a form is submitted:
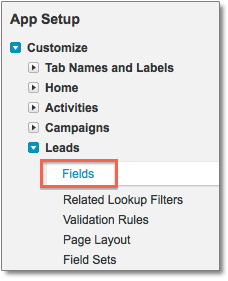
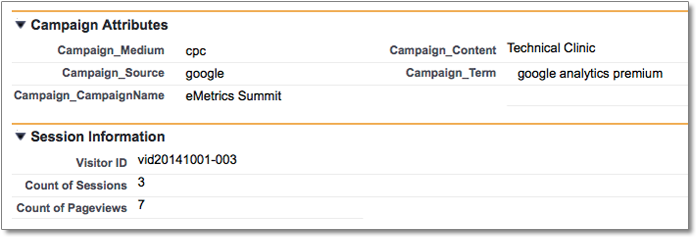
1. Setup SalesForce Custom Fields Create the following 8 fields in SalesForce:
- Visitor ID: a unique, persistent, and non-personally identifiable ID string representing a user.
- Medium: The marketing channel. Possible medium include: “organic”, “cpc”, “referral”, and “email”.
- Source: The referral origin. Possible sources include: “google.com”, “facebook.com”, and “direct”.
- Campaign: Name of the marketing campaign.
- Content: Additional campaign identifier.
- Term: The words that users searched.
- Count of Sessions: The number of visits to our site including the current session.
- Count of Pageviews: The number of browsed pages prior to the form submission.
2. Add Hidden Fields to Forms Add the 8 variables created in the previous step as hidden input fields to all forms in your website in which you want to track in Salesforce.
3. Setting Visitor ID Value of the Visitor ID hidden input field can be read from the backend system (This is the same value that we will use later to set a Google Analytics custom dimension).
4. Setting Campaign and Session Information The values of the hidden fields can be read from the JavaScript file referenced in step 7. The code will generate GA cookies and parse out the campaign variables from the cookies and make them available in the 7 following variables:
source, medium, term, content, campaign, visit_count, and
pageview_count.
5. Pass values to hidden fields. Logic should be put in place within the form to pass the values of the hidden fields to their corresponding fields within SalesForce when the form is submitted.
6. Download GASalesforce.js Download it from here to your local environment.
Download GASalesforce.js
7. Cross Domain Tracking If cross-domain tracking is needed, update GASalesforce.js with a comma-separated list of domains to set up automatic cross-domain link tracking. Example:
var domains = ["mydomain1.com", "mydomain2.com"];
8. Reference the GASalesforce.js file. Placing the following code before the closing tag on every page of the site.
< script src="http://www.mydomain.com/scripts/gasalesforce.js" type="text/javascript">
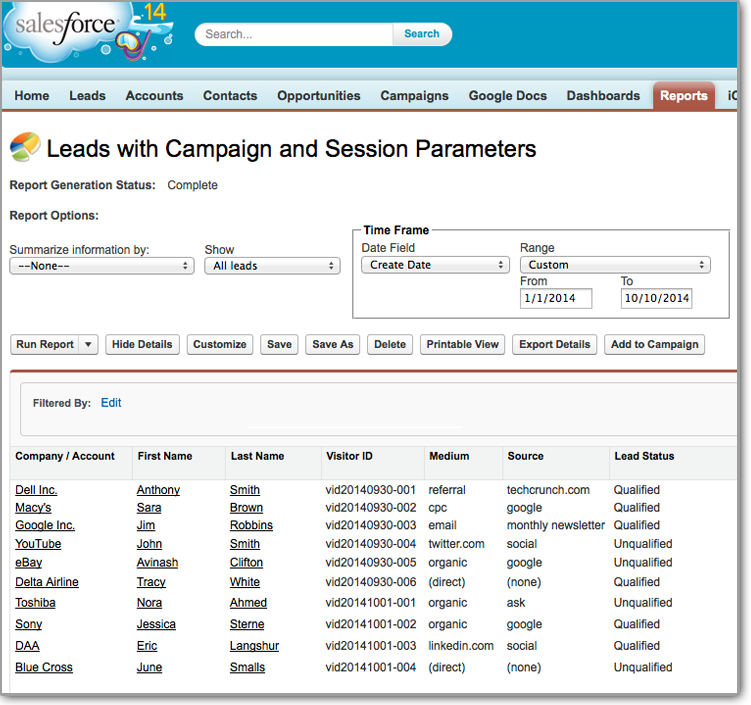
9. Make sense of the data! Now after we successfully collected all campaign and session data in Salesforce, we can make more sense of it and can extract intelligence.

Passing Salesforce Data to GA
In this section, we’ll utilize a really cool new Google Analytics feature called
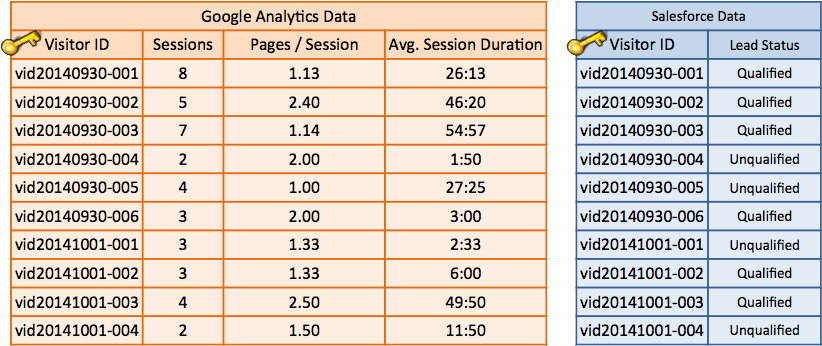
Data Import to pass customers’ lead information from Salesforce into GA. With Data Import, data can be uploaded from different data sources and combined with the existing Google Analytics data to create one powerful and robust unified report. The “key” that we’re going to use to marry the two data sets will be the Visitor ID. If Google Analytics finds matching keys, it will join the data in that row of imported data with the existing GA data.
Step One: Create Custom Dimensions Since “Visitor ID” and “Lead Status” don’t exist as dimensions in Google Analytics, you’ll need to create them as a
Custom Dimension.
| Custom Dimension Name | Scope |
|---|
| Visitor Id | User |
| Lead Status | User |
Note: You must pass your own visitor ID to Google Analytics as a custom dimension to represent each user who submitted one of your forms in question. When you have a unique, persistent, and non-personally Visitor ID, set it directly on the tracker as in the following example:
ga('set', 'dimension1', 'vid20140930-005');Step Two: Create the Data Set 1. In Admin, go to the account and web property that you want to upload data.
2. Click
Data Import under PROPERTY.
3. Click
New Data Set.
4. Select “User Data” as the Type.
5. Name the Data Set: “Lead Status”
6. Pick one or more views in which you want to see this data.
7. Define the Schema:
Key: Custom Dimensions > Visitor ID
Imported Data: Custom Dimensions > Lead Status
Overwrite hit data: Yes
Click
Save.
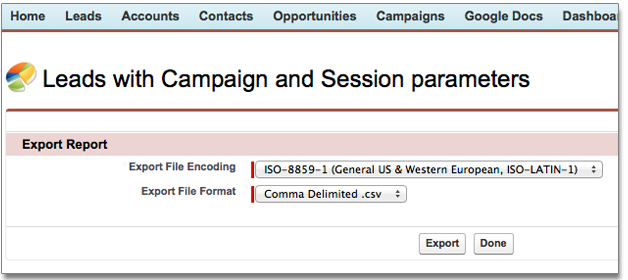
Step Three: Export Salesforce data Export the lead status data from Salesforce into a CSV file.
Step Four: Upload the data 1. In the Data Set table, click “Lead Status”. That will display the schema page. 2. Click
Get schema. You’ll see something like the following:
CSV header
ga:dimension1,ga:dimension2 This is the header you should use as the first line of your uploaded CSV file. The table below identifies the columns:
| Visitor ID | Lead Status |
|---|
| ga:dimension1 | ga:dimension2 |
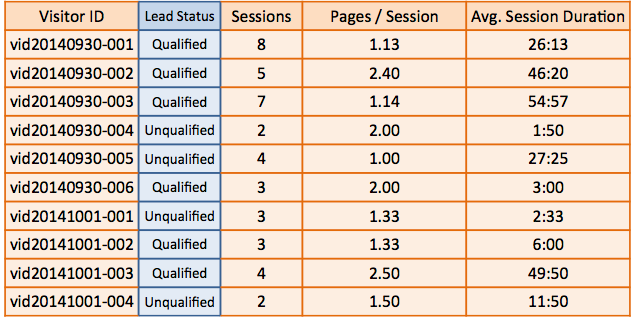
3. Update the exported CSV file to follow the below format. The first (header) row of your spreadsheet should use the internal names (e.g. ga:dimension1 instead of Visitor ID). The columns beneath each header cell should include the corresponding data for each header. The CSV file should look something like this:
ga:dimension1,ga:dimension2
vid20140930-001,Qualified
vid20140930-002,Qualified
vid20140930-003,Qualified
vid20140930-004,Unqualified
vid20140930-005,Unqualified
vid20140930-006,Qualified
vid20141001-001,Unqualified
vid20141001-002,Qualified
vid20141001-003,Qualified
vid20141001-004,Unqualified
4. In the Manage Uploads table, click
Choose Action >
Upload files. Choose the CSV file you created.
Step Five: Create Custom Report Since custom dimensions don’t appear in standard reports, create a Custom Report with our two dimensions (
Visitor ID and
Lead Status) and your desired metrics. Note:
1. Uploaded data needs to be processed before it can show up in reports. Once processing is complete, it may take up to 24 hours before the imported data will begin to be applied to incoming hit data.
2. Data Import also now supports a new Query Time mode that allows linking data with historical GA data. Query Time mode is currently in whitelist release for Premium users.
And now you can analyze the online user behavior of only those who are marked offline as qualified leads.
Wow, this was a long post! But there you have it – very common uses cases for those of us ready to move their marketing optimization a notch up. I welcome your comments and other use cases our readers come across.

 Step Four: Upload the data 1. In the Data Set table, click “Lead Status”. That will display the schema page. 2. Click Get schema. You’ll see something like the following: CSV header
ga:dimension1,ga:dimension2 This is the header you should use as the first line of your uploaded CSV file. The table below identifies the columns:
Step Four: Upload the data 1. In the Data Set table, click “Lead Status”. That will display the schema page. 2. Click Get schema. You’ll see something like the following: CSV header
ga:dimension1,ga:dimension2 This is the header you should use as the first line of your uploaded CSV file. The table below identifies the columns: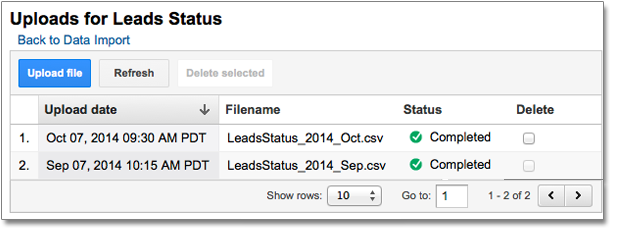 Step Five: Create Custom Report Since custom dimensions don’t appear in standard reports, create a Custom Report with our two dimensions (Visitor ID and Lead Status) and your desired metrics. Note:
1. Uploaded data needs to be processed before it can show up in reports. Once processing is complete, it may take up to 24 hours before the imported data will begin to be applied to incoming hit data.
2. Data Import also now supports a new Query Time mode that allows linking data with historical GA data. Query Time mode is currently in whitelist release for Premium users.
Step Five: Create Custom Report Since custom dimensions don’t appear in standard reports, create a Custom Report with our two dimensions (Visitor ID and Lead Status) and your desired metrics. Note:
1. Uploaded data needs to be processed before it can show up in reports. Once processing is complete, it may take up to 24 hours before the imported data will begin to be applied to incoming hit data.
2. Data Import also now supports a new Query Time mode that allows linking data with historical GA data. Query Time mode is currently in whitelist release for Premium users. 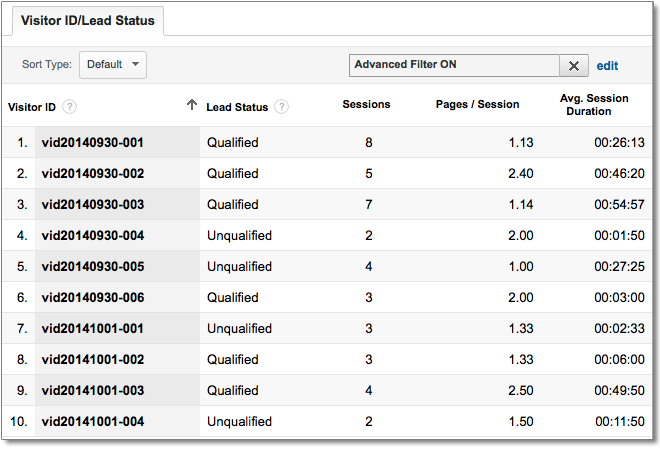 And now you can analyze the online user behavior of only those who are marked offline as qualified leads.
 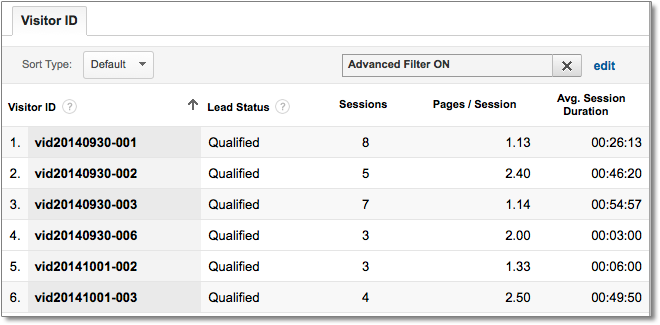 Wow, this was a long post! But there you have it – very common uses cases for those of us ready to move their marketing optimization a notch up. I welcome your comments and other use cases our readers come across.


