
Picture from Getty Images
No, this isn’t the new horror movie by M. Night Shaymalan, but there is a twist at the end!
A couple of weeks ago, Google Analytics made slight changes to their labels. They changed “Visits” into “Sessions” and “Unique Visitors” into “Users”. While intuitively this makes a lot of sense, many of our clients have been confused by the affect this has on the math and the metrics presented by GA, particularly the total visitors aren’t adding up to the total users.

New Visitors and Returning Visitors Don’t Add Up to Total Users
Let’s pretend you’re an analyst for the California DMV and you’ve been asked to find out how many people have renewed their vehicle registration online for a given time-period. Easy – you create an advanced segment to filter converted traffic (in this case, traffic that ended in registration renewal) and you look at the Sessions/Users reports to find out.
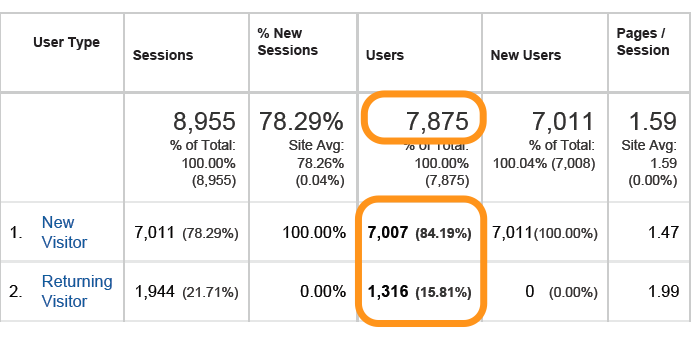
You have a total of 7875 users.
New Visitors + Returning Visitors = (7007 + 1316) = 8,323!
Which one is the correct answer of how many people signed up? First the long lines at the DMV were killing you, now the data discrepancy makes you want to poke your own eyes out.
(Note: often times sampling may cause mathematical errors, so if you’re a Google Analytics Premium subscriber, you can look at the unsampled data to triple-check and make sure it’s not being sampled.)
So, what the heck is the issue here?
New Labels, Old Definitions
Before we can figure out what’s happening, we need to understand the Google Analytics definition of each term.
Sessions
A session is the period time a user is actively engaged with your website, app, etc. All usage data (Screen Views, Events, Ecommerce, etc.) is associated with a session. “Sessions” then represent the total number of Sessions within the date range.
Users
Users that have had at least one session within the selected date range. If you think about it, this is a little easier to intuitively grasp than the difference between a “unique visitor” and a “visitor”.
New Users
The number of first-time users during the selected date range.
User Type
New (first-time) or Returning user.
New Sessions
An estimate of the percentage of first time visits. What this really is saying is “sessions that are of a new user”. This is the part that’s a bit confusing. If you’re a Returning Visitor coming for your second session, in plain english, this might be another “new” session, but in GA, it’s not. So by definition, returning users will not have new sessions.
Solving the Mystery: Returning Visitors and Double Counting
So to get the amount of DMV users that have renewed their registration online, looks like it’s between one of two things – adding New and Returning Visitors (different from “new and returning users”) or use the User total?
Looking at the Returning Visitors (and taking into account the date-range) is key here when making that decision and why the totals don’t match.
Meaning that if a New Visitor came during this time period and returned during this same time period, they’d be counted twice (within a given date-range, both as a New Visitor and a Returning Visitor.
What if visitor X came before the given date-range, but then later returned within the given date-range? How would they be counted? They would be counted as a Returning Visitor but that first visit would not be counted as a New Visitor within the specified date-range.
What if visitor X returned 3 times within a date-range? They would be counted once as a New Visitors (if it was their first time), once as a Returning Visitor, but that 3rd visit, they already have been counted as a Returning Visitor, so while the sessions would increase, the Returning Visitor metric would NOT increment!
To get the true number of visitors who were doubled within the date range, you’d need to separate the unique Users from the Visitors aggregate (New + Returning Visitors). Adding up the New and Returning Visitors will include:
- New Visitors
- New Visitors that may have doubled as Returning Visitors if they came back within the date-range
- Returning Visitors whose New Visits aren’t within the date range, and thus only counted once within Returning Visitors.
So the Visitors aggregate (New + Returning) is 7007 + 1316 = 8,323. Subtract the unique Users from that (7875) and you get 448. Again, since the Users are unique, you are basically getting rid of all Unique Visitors. The Returning Visitors with New Visits outside of the date range is actually a “Unique Visitor” respective to the date range, and since you are getting rid of all the Unique Visitors, whatever is left has to be the doubled visitors, which is 448.
Then to get the Returning Visitors that have New Visits outside of the date range, just take the Returning Visitors and remove the doubled visitors that we calculated above. So 1316 – 448 = 868. Those are “Unique Returning Visitors” if you will.
Conclusion
So, to the original question – in this particular case, how many individual users renewed their registrations online? Intuitively you may have thought, “Just add New and Returning Visitors”. As you can see now, those metrics may not add up the way you think it should. You’re better off going with the round number of users, and thus, the number of users who have converted (renewed their registration online) according to this report is 7875.
For more information on how users are calculated in Google Analytics, click here.