Today, Google Analytics released Real-Time, a new dashboard that will show your website traffic and certain metrics as it happens. Google Analytics has shown they are committed to the free version, by making this feature free and available to all starting today. The data that is shown only has a delay of 1-2 seconds from when a visitor clicks to one of your pages.
Main Dashboard
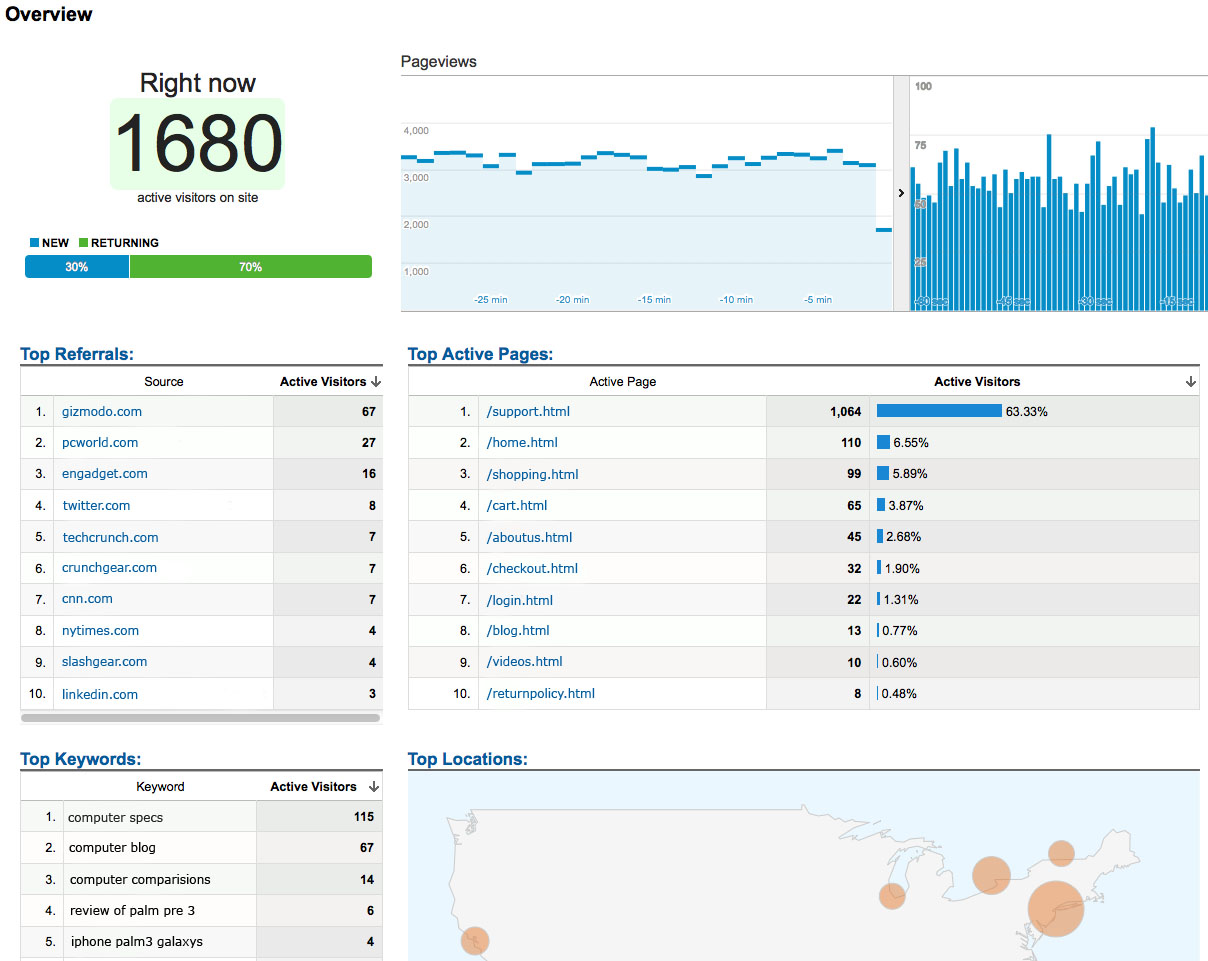
The image to the right is the main dashboard for Real-Time, you can click on it for full size. The top of this report is the most visually appealing part, the top left shows there are 1,680 active visitors on the site. These visitors have been active within the last 30 minutes. Every 10 seconds this number updates. The graphs to the right show pageviews by minute and second. These graphs update every second, and watching them update can be quite mesmerizing. The video embedded below, shows these first graphs and metric updating.
Looking at the middle of the main dashboard we can see the top referrals/referring sites that are sending our site traffic. Top active pages finishes out the middle portion, by showing us where all of our visitors currently are on our site. These visitors have been active in the last 5 minutes, any one not active for over 5 minutes is dropped. The bottom of the main Real-Time dashboard shows us the organic keywords that visitors searched for to find our site, and what locations they are coming from. If you want to see the top of the dashboard in action, watch the video below. Scroll down to read and learn about the other reports included in Real-Time and how all of this may be useful to you.
Content, Traffic Sources, and Locations
Real-Time includes 3 other main reporting sections besides the overview. Content, Traffic Sources, and Locations provide you with more detail about how visitors got to your site and what they are currently doing. The Content report will let you see the top 20 pages visitors are on right now and over a rolling 30 minute period. You can select any of the pages and the top 20 sources for where the visitor originally came from to get to that page will be shown.
The Traffic Sources report will show you how visitors got to your site instead of a specific page like in the Content Report. This allows additional drilldown into each medium of traffic (organic, referral, cpc, etc) that is sending traffic to your site. For example, if you click on organic, you will see a list of all the search engines that sent traffic and clicking on one of these will show you the keywords for a particular search engine. If you are campaign tagging emails you are sending out, you could drilldown and see which emails visitors clicked on to get to your site in this report as well.
The Locations reports shows a map and table of what countries are sending traffic. You can drilldown on a country and see the cities visitors are coming from. Google added in a fun feature by allowing you to change the map view to the Google Earth view. This will zoom to a random visitors location in 3D every 10 seconds. This would be an excellent view for a TV in a lobby for your company. Below is a video of this happening, its much more smooth in the actual report, but I think I still captured it decently.
How This is Useful and a Feature Request
Overall Real-Time feels very polished and is a great addition to Google Analytics. There are a variety of ways Real-Time will be useful. Depending on the size of your account Google Analytics can take up to 24 hours to show you data, Real-Time shows you it within 1-2 seconds. Lets take a social media campaign, which usually has a very short period of engagement. You can see visitors coming in Real-Time and see where they are going on your website. Lets say you are seeing visitors make it to the shopping cart page, but the conversions aren’t happening. You could go back to your social media post and offer an incentive such as a discount code or free shipping code, to try and rectify the low amount of conversions. Before Real-Time, it would take up to 24 hours for this data to appear in your reports, but now you can view and act upon incoming data as quickly as you desire.
One feature that I hope to see added soon is the ability to set custom alerts for Real-Time data. I know some of you will have Real-Time open 24/7 in the corner of your screen, but imagine how useful it would be to have Google Analytics send you an e-mail or even a text message if all of a sudden your site saw an increase of 260% the amount of expected traffic. You could then go look inside Real-Time and see your website was receiving a huge amount of traffic from the New York Times. Further investigation showed that you are featured in an article on their homepage. You could then alert your marketing manager and start pushing out content to promote this. The way Real-Time is right now, unless you are glued to your screen, Real-Time is reactive, meaning you usually will not look at it until you have a question that it could help answer. With custom alerts, it would become a proactive tool, sending you alerts when unexpected behavior occurs. The tool was just released, but it is my opinion that Google will have more additions for us!


