No matter what the latest marketing channel or marketing buzzword is, email marketing is here to stay and you’d better be paying close attention to it. We’ve covered some basic email marketing strategies in the following parts:part 1, part 2 and part 3. But once you’ve got a solid email marketing program, you’ve gotta be measuring how it did! This post is about email marketing analytics, and in line with our “user-centric” approach to measurement, I’ll share tips with you on how to report not only on traditional email metrics, but also how to see a 360 view of your customers and prospects.
The beauty of the user-centric approach is that your data will be specific to your customer base. You’re not just looking at “open rates” or “click-through rates” in just email marketing, but you’re measuring the entire user experience. This way, you can better decide what works and what doesn’t work based on the interaction with the user. Tracking helps you to constantly improve your email, web and mobile content and approach based on your customer’s overall behavior.
Tracking
First let’s cover the basics. Most email marketing platforms, such as Exact Target, Responsys, iContact, MailChimp, Constant Contact, VerticalResponse, etc. all have integrated tracking. In fact, you don’t even need to set anything up – they’ll have a report ready for you as soon as the email campaign has been sent. In the report, you get pretty decent metrics.
Here is a sample of what you would see from an email-marketing provider:
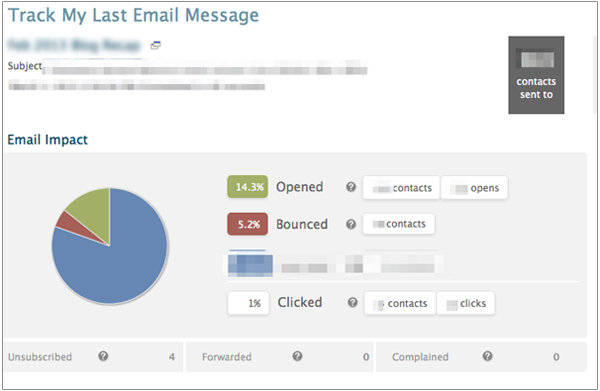
- Open Rate – the number of people who opened your email as well as the total number of times your email was opened.
- Action: If you have a low open rate, let creative juices flow and come up with more compelling subject lines. Test sending at different times of the day, different days of the week, etc.
- Click Rate – the number of people who clicked a link in your email as well as the total number of times links were clicked in your email.
- Action: More than likely, the purpose of your email is to get the reader to take action. More often than not, that’s to click on something and go somewhere on your website. If this metric is low, maybe the quality of your content is not where it needs to be. Maybe the offer is not that compelling. Also, make sure your links and “Calls-to-Actions” are visible; the goal is to get more interaction with customers.
- Bounces – the number of people who didn’t get your email e.g. their email account could not be reached.
- Action: To avoid bounces, make sure you collected the list of contacts yourself by having a sign up list on your site, or having them opt-in to receiving special offers from you once they make a purchase.
- Unsubscribes – the number of people who removed their email from your list, using the subscription management link (email platform will always include this on emails sent through their system) at the bottom of the email.
- Action: To avoid unsubscribes, make sure the information you are presenting to your customers is relevant to them. When initially creating your list, having subscribers opt-in would most likely decrease this too, since they’ve chosen to hear from you. Most likely if you added someone without their permission, they may not want to be bothered and unsubscribe. Also, maybe you’re sending too many emails? That can be annoying and cause someone to unsubscribe.
- Forwards – the number of people who forward the email using “Forward to Friend” at the bottom of the email. The email platforms can (should) not capture data of people clicking the actual forward link in their email client.
- Action: You’re doing something right if this is high, if your customers are forwarding to their friends! Keep it up!
- Complaints – the number of times a contact reports your message as spam in their email clients.
- Action: Similar to unsubscribes, to avoid complaints, make sure you are not spamming your customers, don’t send multiple emails a day and make sure you are sending information that is relevant to them. A great way to ensure people don’t unsubscribe is segmenting your contacts into lists of content that is relevant to them, this way they are only receiving content that they signed up for.
Now if you have been reading our blog and follow our Reporting Framework, you know that you should be trending your KPIs, and you could do that easily in Excel and come up with something like this:
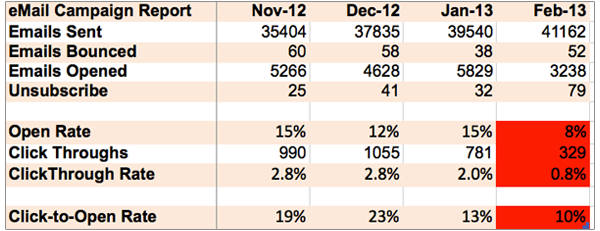
WOW! What happened to our open rates and click-through’s in Feb!! We can see some issues, so now we can take action!
Post Click – Tracking in Google Analytics
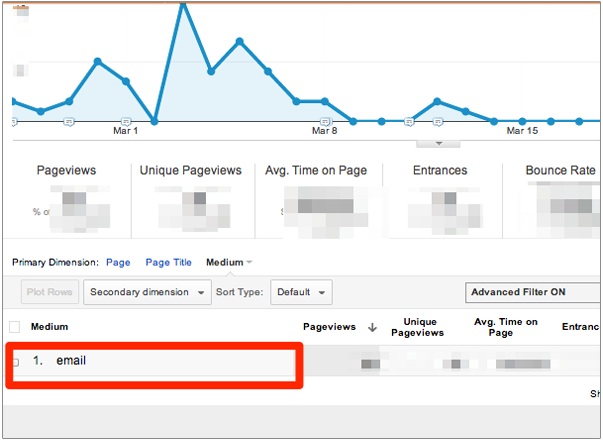
Hopefully, you can tell this is all great information for the email blast itself, but what happens after your email subscribers clicked on the link in your email and landed on your website? This is where Google Analytics comes in.
The email platform will allow you to track the amount of clicks and opens for your blast. But what web analytics platforms such as Google Analytics will do, if you have it set up on your website and have properly tagged your emails, by connecting the two, you get insights on what happens after they’ve clicked the links in your email. See how engaged your email visitor is with your site.
Tagging and Segmentation
Adding a simple tag to the links on the email blast will allow you find out:
- …if they convert
- …fill out a form
- …watch a video
- …and much more.
This is obviously quite useful, especially if you have eCommerce set up in Google Analytics you can track revenue per email campaign.
In case you are not familiar with the concept of URL tagging, read our post about tracking online marketing campaigns with google analytics to learn more.
Tagging properly to segment your visitors in Google Analytics can be useful when trying to figure out what works best for particular audiences. For example, let’s say you’re having a sale and want to see if “20% off” would capture more attention than “Free Shipping”. The first thing would be to segment your list. Segmenting will allow you to send the same email blast to different sets of people or you can even send two different emails based on your audience to see which performs better. The first email will have a subject line of “20% off your purchase today!” and the second email will be “Buy now & get free shipping.”
Now that you’ve created two blasts, you can add utm tags. A utm tag allows you to make each link unique by adding fields that will appear in Google Analytics reports. To generate this unique link, use E-Nor’s URL builder or another awesome tool for tagging is Campaignalyzer.
When using the URL builder, there are three required fields:
- Campaign Source is where your traffic is coming from. For example, if you paste the link on “Facebook”, and want to track the visits from there, you can use that as your source. In the case of email tagging, you can use it to identify your segment type. For example, use “leads” for a email blast to your leads list. You can use “prospects”, “customers”, “male”, “female”, etc.
- Campaign Medium is a marketing medium, or in other words, the “channel” you are using. In this case, it should always be “email” when linking from an email blast.
- Campaign Name as it says, names your campaign. For example, you can use “April Newsletter” when linking from an email blast for the monthly newsletter in April. You can use the month and year, or even more specifically use the actual day that you are sending it on. You can also use the name of the product you are promoting in the content. If you are sending out newsletters on a regular basis (daily, weekly, monthly, etc.), we would suggest using the date for the campaign name, because it will make things easier when you are looking at reports. Also, if you are testing to see what type of email is getting more conversions, then you will want to use the campaign name to differentiate the emails.
To learn more about url tagging, check out this post on planning before tag 🙂
Thus, if you use the following, your tagged url will look like below:
- Url = https://www.yourdomain.com/page.html
- campaign source=leads
- campaign medium=email
- campaign name=april-fools-newsletter
- Resulting tagged url: https://www.yourdomain.com/page.html?utm_source=leads&utm_medium=email&utm_campaign=april-fools-newsletter
Tip: Always test that your tagged urls appear in the browser and in Google Analytics! You never know what can happen…
Reporting
Now that you’ve tagged your email, the data will be found under medium as email traffic for your deep dive analysis.
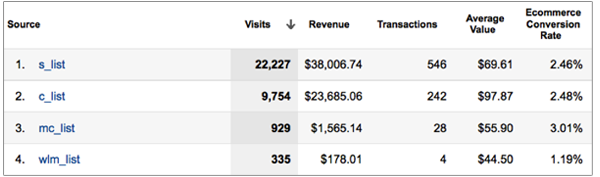
You can also trend data over time and see if there are seasonal impacts to your user’s behavior. You can see how many people continued ‘shopping’ on your site and even if they ended up purchasing/converting or not. If you are doing A/B testing on which email to send out to all your customers, you can analyze between both sets of data and then make a decision about which offer resulted in more revenue or micro conversions.
Integrated Reporting
The above reports are all dandy, but we are still looking at metrics in isolation. Analysis and optimization is all about context. What if you like to view the entire experience in one report, you want to see the number of list subscribers, the open rate of a specific campaign and the associated revenue in one report? Sure, you could do it in Excel, but that’ll be a lot of work.
What we recommend is automatically pulling data out of Google Analytics into Tableau and then be ready for some serious slicing and dicing (for now, you still have to pull the email providers data from a csv file and into Tableau). Again, if you follow our articles, here we are featured on the Google blog explaining how to do that).
Here’s what you’ll see, a nice dashboard in Tableau showing key campaign metrics nicely trended for four email newsletters (NL_1, NL_2, NL_3, NL_4):
- Opens
- Clicks (of those Opens, how many clicked and visited your site)
- Number of transactions
- Revenue generated
- (you can also plot Open Rate, Subscriber/list Growth Rate, Time on Site, email visits from Mobile, etc.)
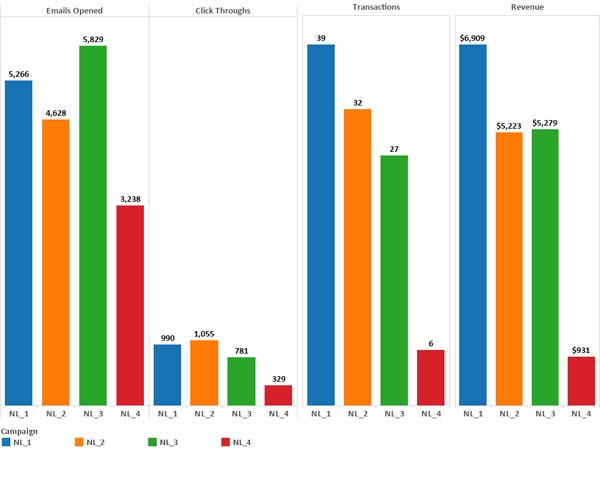
Analysis note: it’s obvious that the Newsletter 4 (NL_4 in red) just tanked in every aspect so address it immediately. It’s also worth noting that while the Newsletter 3 (NL_3 in green) had less transactions than the Newsletter 2 (NL_2 in orange), the revenue number for NL_3 is slightly higher. This indicates that your average order value is higher and whatever you did to upsell or promote higher ticket items worked!!
Advanced Tips
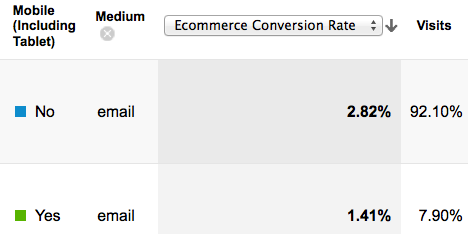
- Mobile Analytics & Engagement
- Don’t forget to assess your users mobile experience and expect that more people are using the mobile phones and tablet to access email, browse and shop. Go to your mobile reports and segment by “medium” and select the “ecommerce conversion rate” metric. You’ll quickly see that your mobile users convert at half the rate than your desktop users!! A quick “lost opportunity” analysis will convince your manager to invest into a responsive design for your site or maybe a mobile site.

- Don’t forget to assess your users mobile experience and expect that more people are using the mobile phones and tablet to access email, browse and shop. Go to your mobile reports and segment by “medium” and select the “ecommerce conversion rate” metric. You’ll quickly see that your mobile users convert at half the rate than your desktop users!! A quick “lost opportunity” analysis will convince your manager to invest into a responsive design for your site or maybe a mobile site.
- Universal Analytics:
- This will be the subject of a more detailed blog post, but since Universal Analytics is the future, start thinking of what metrics you want to pull into Universal Analytics from your email marketing efforts. Passing a “user id” (ensure it’s don’t include personally identifying information) is a good start. Work with your email providers to pass the “user id” with the click/visit and then once once the visitor clicks the email link and they are on your site, grab the “user id” and store it in a Custom Dimension. You can then report and export your reports (with user ids) into your BI tool.
- Filter out auto-respond emails, confirmation emails.
- Scenario: A user arrives at your site via an organic search. The user performs some action which results in him receiving a system generated email containing a link back to the site (for example, an account activation email). If the user clicks on the link to go back to the site, it’s very likely the medium of the original visit will be overwritten to Referral, particularly if the user is using a web-based email client. (In the case of Microsoft Outlook, this would be considered a Direct visit, but the medium wouldn’t be overwritten since returning Direct visits don’t override the original medium.) The “no override” parameter shown below prevents this problem from manifesting. The parameter utm_nooverride=1 can be added to all system generated e-mails, such as registration and password reminder e-mails. For example, a password reset link such as:
https://mydomain.com/password-reset.htm?resetid=ABC123
Can be updated to
https://mydomain.com/password-reset.htm?resetid=ABC123&utm_nooverride=1
- Scenario: A user arrives at your site via an organic search. The user performs some action which results in him receiving a system generated email containing a link back to the site (for example, an account activation email). If the user clicks on the link to go back to the site, it’s very likely the medium of the original visit will be overwritten to Referral, particularly if the user is using a web-based email client. (In the case of Microsoft Outlook, this would be considered a Direct visit, but the medium wouldn’t be overwritten since returning Direct visits don’t override the original medium.) The “no override” parameter shown below prevents this problem from manifesting. The parameter utm_nooverride=1 can be added to all system generated e-mails, such as registration and password reminder e-mails. For example, a password reset link such as:
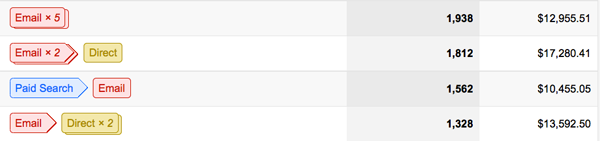
- Attribution & Multi-Channel Funnels (MCF) for your email marketing program:
- Keep in mind that we all browse many sites before we buy or submit a request for more information. And we are likely to revisit the same site many times before we do so. To see all these touchpoints and how your email channels contributes and assists conversions, make sure you review the MCF reports in in Google Analytics. Here is a snapshot at the Top Conversion Paths along with the number of conversions and conversion values for each path. It takes some of us 5 emails to convert!!
Here you have it! Any other email marketing analytics tips you like to share?


