As an avid Gilmore Girls fan since it first aired back in 2000, I’ve been waiting in extreme anticipation for the revival for the past 9 months. Gilmore Girls has always been like comfort food for me – I own all the dvds’ and watch the series all the way through at least once a year and whenever it airs on tv, I watch it. When the show ended back in 2007, I was annoyed but content with the ending, knowing that there was nothing else that could be done to change or add more to it (even though it was abruptly cancelled after Season 7). Still, I always wished there would be more Gilmore Girls but I never imagined that it would ever be revived.
It was a very much welcomed surprise when the original creators of the show, Amy Sherman-Palladino and Dan Palladino, decided to revive it for four 90 minute episodes with Netflix.
Now you might be thinking, “E-Nor (now Cardinal Path) is a digital analytics company – what do they have to do with an old-school, fast-talking revived WB show?” At E-Nor, we believe measuring the data is half of the battle, while visualizing can tell important stories. As marketers, these stories can lead to decisions and actionable insight.
According to Wikipedia, during the show’s 5th season, it became the ‘second-most-watched prime time show, with viewer numbers that grew by double digits in all major demographics.’
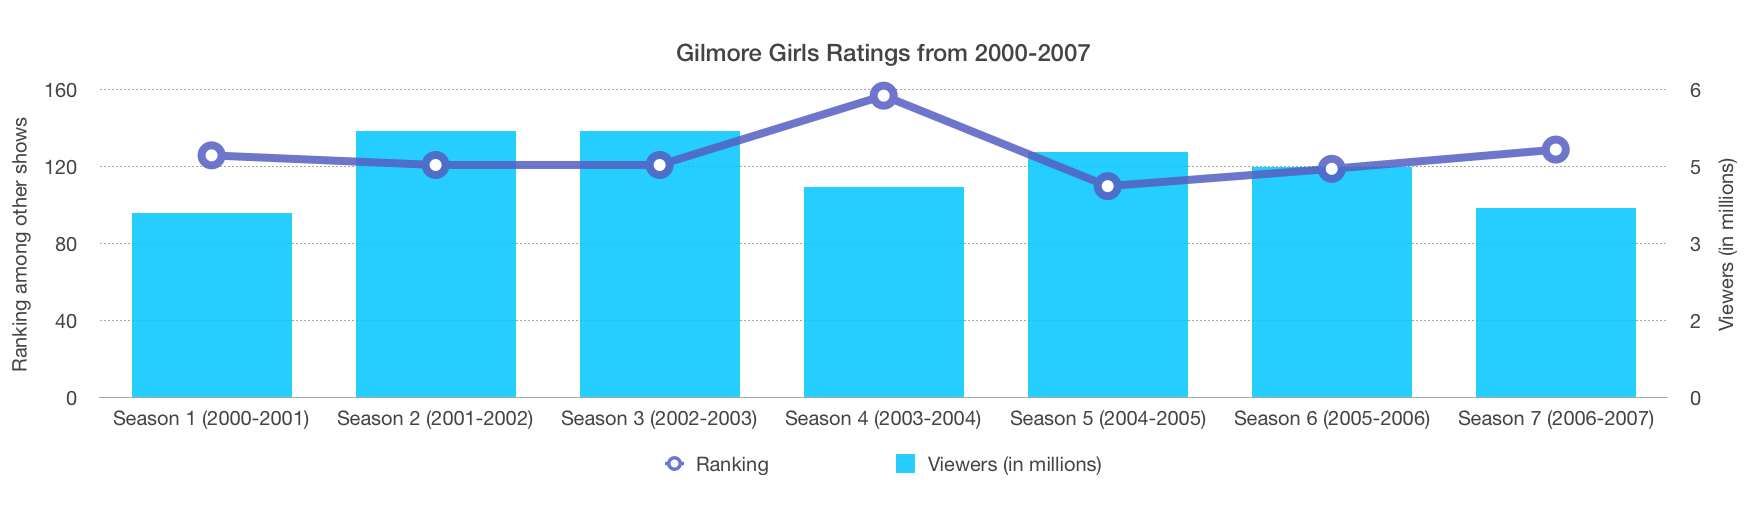
While the show was on air, it received an average of 5 million viewers each week, which isn’t bad if you look at it in the context – Friends was on the air at the same time!
The series has enjoyed a second life in reruns on Freeform and UP networks. According to Vulture, “Freeform, aired [Gilmore Girls] around 400 times last season drawing a collective audience of 11 million. The daily audience for Gilmore reruns is still pretty tiny. Most episodes of Gilmore on UP brought in just under 100,000 viewers last season; the Freeform plays averaged 120,000. While viewership on some days can spike dramatically — an episode Monday on Freeform averaged almost 200,000 viewers. Still, not that many hour-long shows from the early part of the century — particularly those from a small network such as WB — are still even airing regularly on one cable network, let alone two.”
The Social Conversation
Ever since Netflix added Gilmore Girls to it’s queue on July 1, 2015, the show seemed to increase in viewership and social conversation. Quickly a new set of viewers who were far too young when the show originally aired became dedicated fans.
Shortly after the show was added to Netflix, the cast of the show reunited at the ATX festival in Austin, Texas. Many rumors began about a revival in the works. According to Forbes, ‘Twitter logged around 17,000 tweets with “Gilmore Girls’ mentions surrounding the ATX appearance.’ A few months later, Twitter reported approx. 47,000 Gilmore Girls tweets after Lauren Graham, who plays one of the main character, Lorelai Gilmore, hinted a revival.
DUDES. I can’t confirm this. But I also can’t deny this… https://t.co/KO8gA7j6Us
— Lauren Graham (@thelaurengraham) October 19, 2015

Number of Tweets discussing Gilmore Girls and revival possibility.
On October 5, 2016, Gilmore Girl’s Sweet 16, Netflix transformed over 200 local coffee shops across the United States to a Luke’s Diner (beloved diner in the show), where they served free hot coffee to the first 250 customers in custom to-go Luke’s coffee cups. The pop-up Luke’s Diner was a big hit, many fans, like myself, waited in long lines to get their hands on their own Luke’s coffee cup. See below for spike of social discussion in October.
Facebook Data talking about Gilmore Girls as fans anticipated the revival
Besides releasing trailers, and advertising the show heavily online, Netflix also converted UCLA Dickson Court into a Stars Hollow (the fictional town where the Gilmore girls lived) experience, The Festival of the Four Seasons, the weekend prior to the revival release on November 19 and 20, 2016. I think it’s safe to say that Netflix expected a ton of viewership for the much anticipated revival, again fans in Southern California flocked to UCLA to experience the small town.
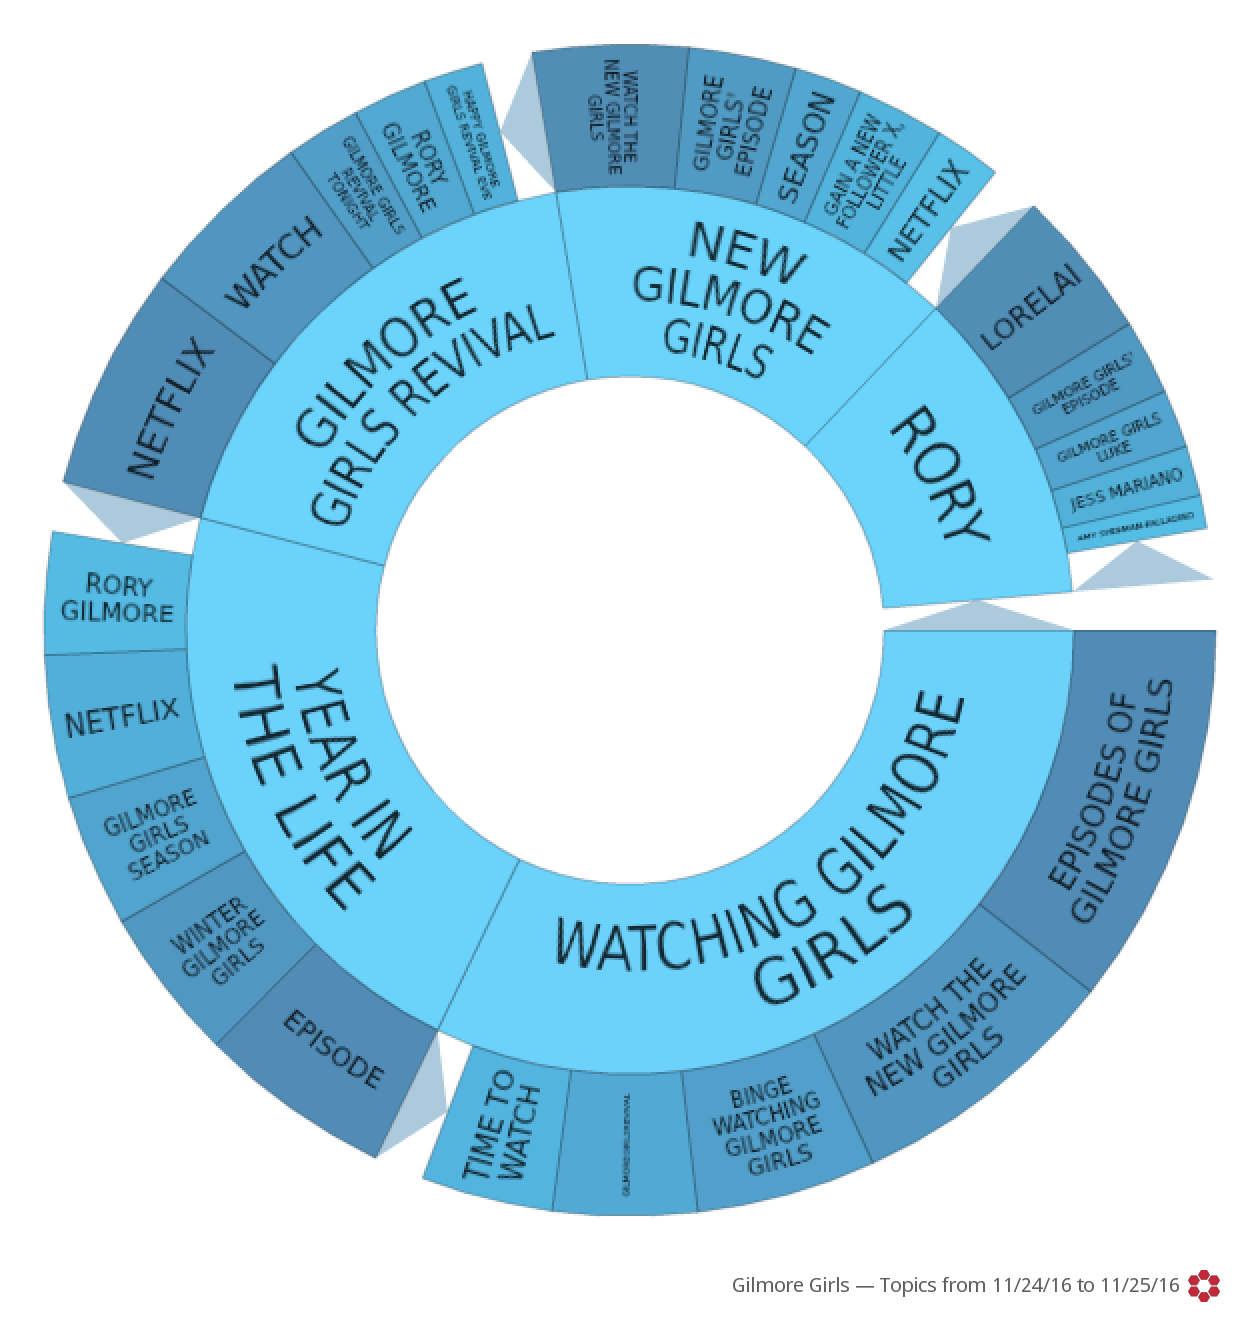
From the night of the revival release (November 25th, 2016 at 12:01 PST), #GilmoreGirls was a trending topic on Twitter and Facebook for a couple days. Here are some nifty social media analytics graphs leveraging the powerful platform that our partners, Crimson Hexagon, offer.
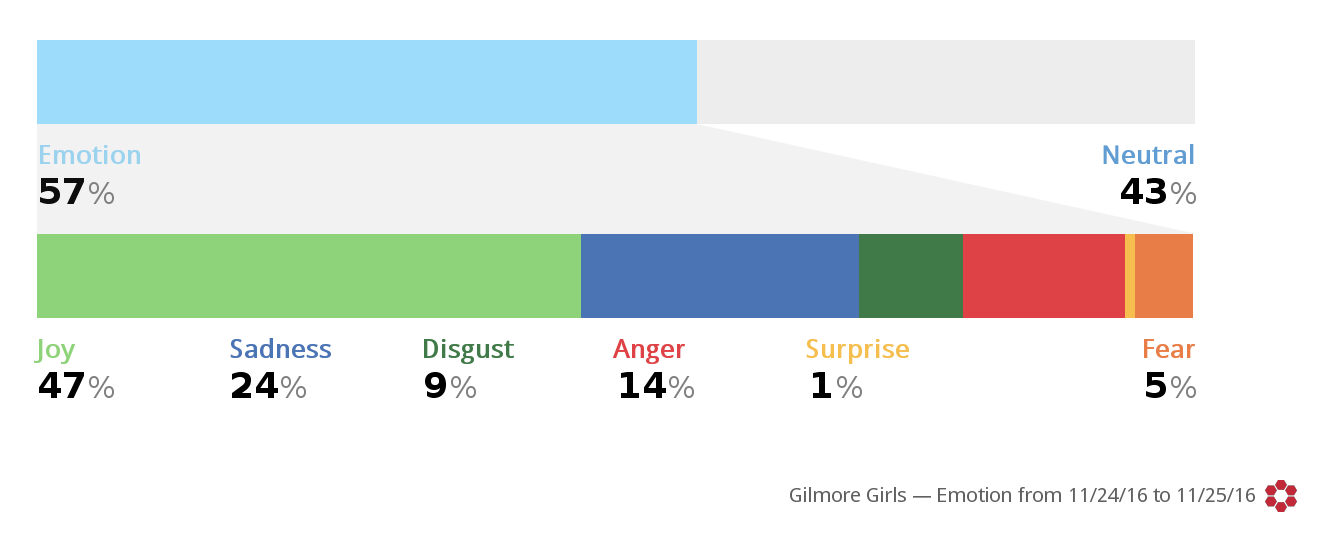
Facebook emotion reaction from November 24-25, 2016
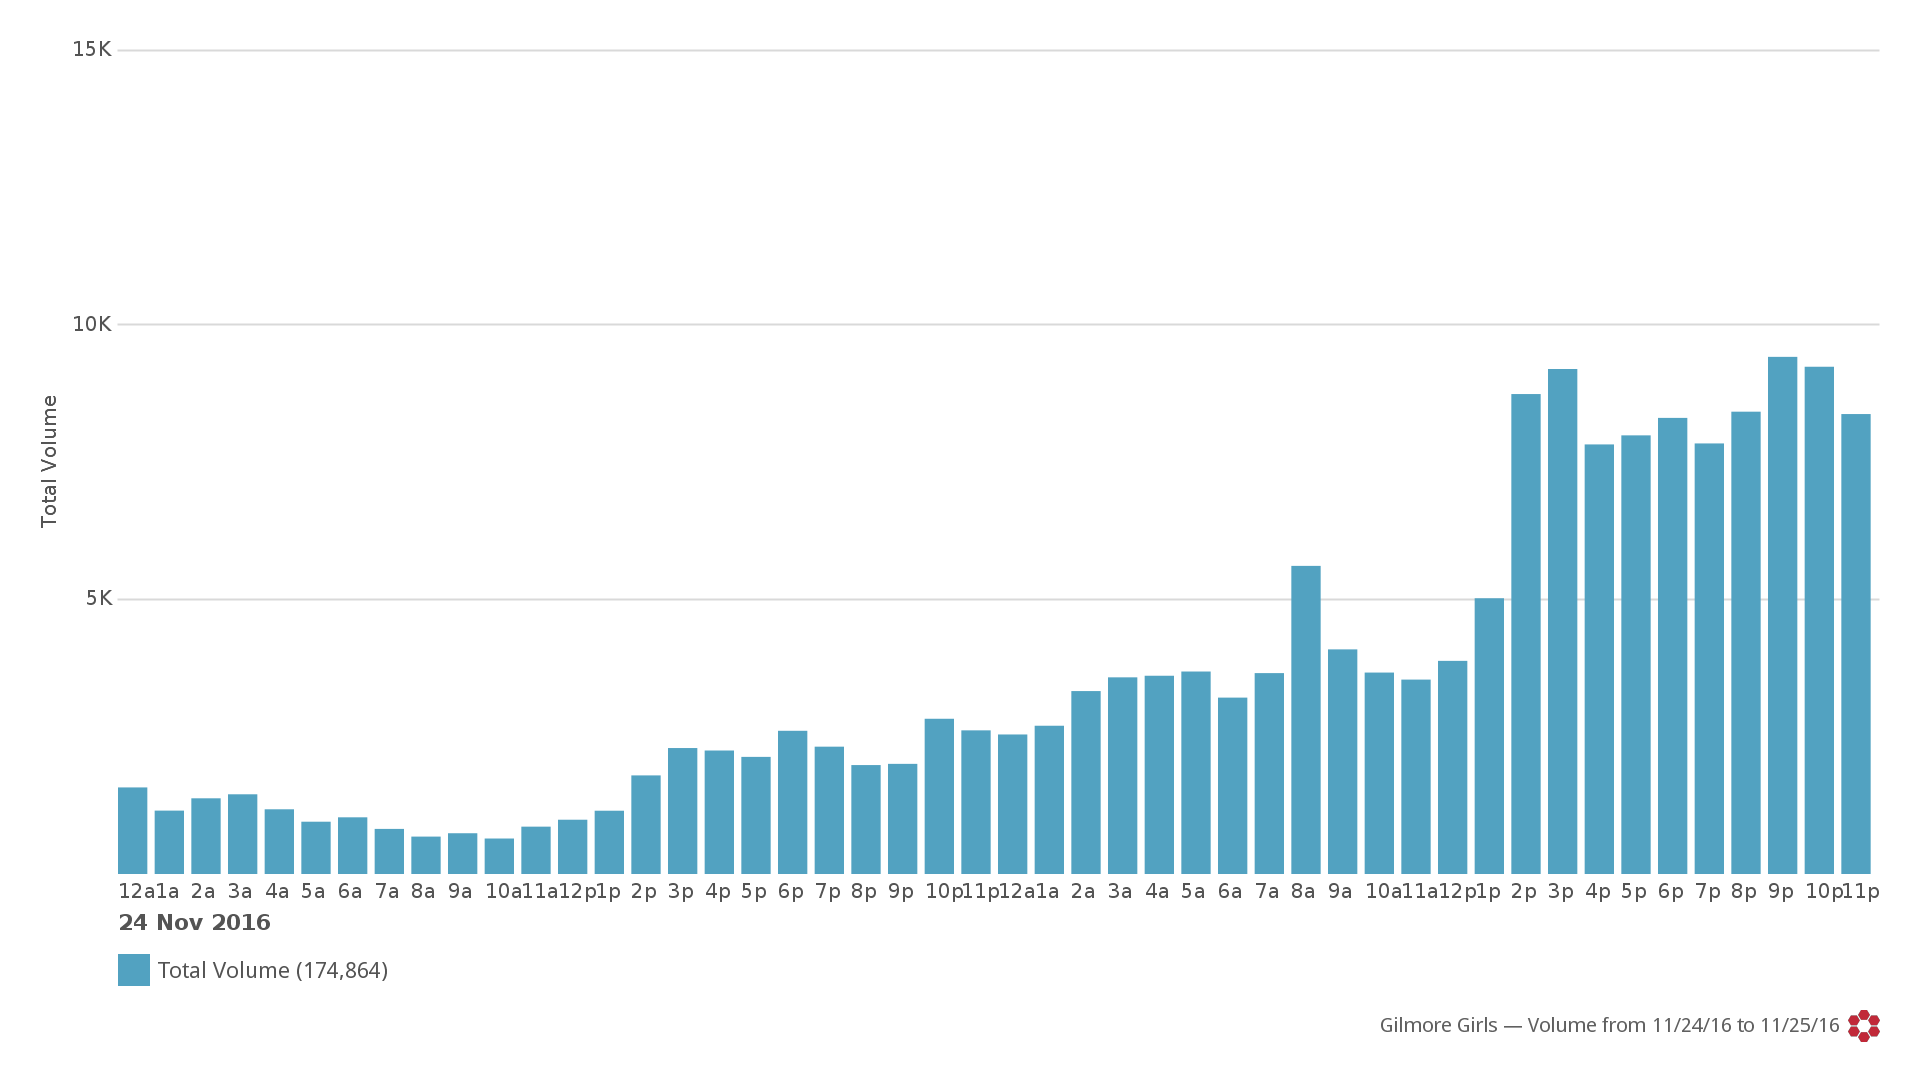
Volume Trends from November 24-25, 2016
Entertainment Weekly reported that Symphony, streaming tracking company, claims that Gilmore Girls: A Year in the Life brought in 5 million viewers (18-49 viewers) within the first 3 days of release. Unfortunately for us, Netflix is pretty tight-lipped on providing their rankings to the public, and are not endorsing Symphony. So, we may never know how many people watched Gilmore Girls: A Year in the Life, but as marketers, we can get a measurable idea of how successful their marketing campaigns are through social listening and measuring sentiment. And thanks to this confidence, we got to enjoy one more season of quirky, fast talking, sarcastic, mother-daughter sisterly banter and wit!


