We’re in the final lead-up to the 2011 Canadian Federal Budget announcement, which will take place on Tuesday, March 22. As someone who spends their professional life measuring and evaluating the online space, it occurred to me that this budget, unlike many before it, is already having a big impact on social media. To test out my hypothesis, I decided to do a quick analysis by looking at one component of the social media-sphere: Twitter traffic.
My methodology was to mine for hashtag-based traffic (hashtag are simply a means to group and track a conversation on any issue, subject, person etc.. They are denoted by prefixing the has symbol to a word, e.g. #politics).
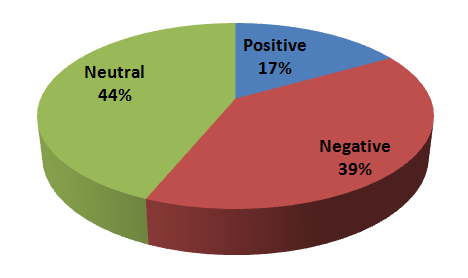
Sentiment analysis – only 17% positive
I’ve done research and found many different tags that can apply to the upcoming budget, but for this exercise, I’ve decided to focus on one very popular Canadian political hash tag: #cdnpoli. From #cpc, #gpc, #ndp and #lpc through to #harper, #conservatives and #budget2011, I’ve discovered virtually all of them – and there are a lot. For example, between 12am Saturday morning to 7pm on Sunday evening, the #cdnpoli hash tag amassed over 3,400 mentions in Twitter.
What did I find and what are these tweets telling me? It’s VERY hard to say. There is no one “right” way to define the sentiment of tweet as so many factors are at play. If the tweet favours one political party, but not another, is this negative or positive (and wouldn’t this depend on my political point of view)? Is the sentiment based on the context of the message itself?
My goal was to see what the vibe was the weekend prior to the budget. I wanted to know how many were positive, negative, neutral, and how many, (if any) even mentioned the budget. A review of thousands of tweets for sentiment is actually very complicated. Therefore, I used a sampling method and looked at every 25th tweet for this evaluation (over 130 tweets in this 43 hour period). Here’s what I found:
Positive: 23 – Negative: 54 – Neutral: 60
It is very important to consider that this is a cursory glance at what the overall Twitter sentiment is during this time period. Moreover, in order to truly get the sentiment of the message, it would be essential to visit the links (often bit.ly formatted links) and read the information on the destination landing page before making a conclusion. I found that it is very hard to determine the difference between a positive tweet or a negative tweet when a strong tone of sarcasm seemed to permeate the tweet. A quick glance at the pie chart above leads to the simple conclusion that people tend to tweet more about this topic out of neutral and negative contexts rather than positive. Further analysis will be required to conclude this for sure, however.
Budget a big deal? Out of 3,440 tweets over the weekend which included the #cdnpoli, only 49 (a mere 1.4%) of them include mention of ‘budget’. None of these tweets voiced any strong concerns, anticipation, nor anything else directly related to the budget, other than the hashtag itself.
It is also possible to take a quick look at the frequency of use of other hashtags. Given the political nature of this topic, we note that #cpc, #lpc and #ndp are among the most mentioned hash tags associated with the #cdnpoli hashtag.
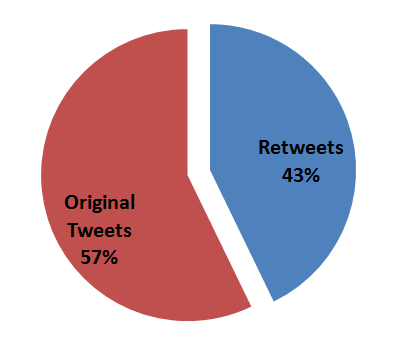
Another challenge to consider when evaluating the Twitter-sphere is the re-tweet (RT) effect. How many of the tweets are original versus re-tweets? In the case of this brief study, I found 57% original and 43% re-tweets.
What else did I find? When it comes to any variety of topics, it’s intriguing to see both the content and how often people write/tweet. With respect to this topic, I found that over 700 people tweeted once, a little more than 180 people tweeted twice, and just one person tweeted 118 times (!!) – that’s an average of one tweet every 21 minutes over the weekend – this is a true super-tweeter (or simply someone with a little too much time on their hands.)
Next steps
We intend to further refine and improve this initial cursory study. Our next step will be to evaluate the tweets at a higher sample rate (perhaps sample every 10th tweet as opposed to every 25th), and identify all hashtags in each tweet to tie the sentiment of the tweet for each of the individual parties. In addition, we’ll also explore the total potential readership of these tweets (to get a sense of the reach) as well as develop an understanding of how many of these Twitter-ers may be classified as influencers.


