We live in a mobile era. About half of the world’s population now owns a smartphone that they use to read news and access other information resources. This new reality has put a lot of pressure on publishers to ensure content quality, availability, accessibility and relevance and thereby increase user engagement and conversion.
The main goal of this post is to provide guidance for tracking content metadata and user interactions on mobile websites with Google Analytics for AMP pages. To learn the basics of AMP tracking in Google Analytics, see Adding Analytics to Your AMP Pages in the GA help pages.
Content Availability and Accessibility
The improvement of content accessibility and availability is a technical issue, which depends mainly on the page load and the website performance. Slow, clunky and frustrating experiences can easily discourage users from engaging with your content and will lead to a decrease in subscriptions and advertising revenue based on pageviews.
The first step in increasing the accessibility of content is to make it available across different platforms and devices so that content load instantly everywhere no matter what type of smartphone, tablet or mobile device is viewed on.
Fast-Loading Pages on Mobile
Until just recently the above technical issue was a real challenge and there was no easy solution to implement, but few months ago Google announced a new platform called Accelerated Mobile Pages (AMP) that seeks to improve the user experience on the mobile Web, especially for publishers and content websites, by delivering much faster-loading pages on mobile devices.
David Besbris, VP of Engineering – Search at Google, said “AMP is great for browsing the web on mobile devices, because Web pages built with AMP load an average of four times faster and use 10 times less data than equivalent non-AMP pages. In many cases, they’ll load instantly. It’s how reading on the mobile web should be—fast, responsive and fun.”
The AMP Project was formally announced on October 7th, 2015 with support from several publishers and technology companies. Check the amazing list of early adopters here: https://www.ampproject.org/who/
Here at E-Nor, we were very excited to jump immediately into adopting the new AMP project since we know how much publishers struggle with the issues the AMP platform came to solve.
Migrating to AMP and Its Impact on Tracking
As digital analytics and online marketing advisors, we are committed to making sure publishers who migrate to the AMP technology have access to the same (if not more) analytics data that they already have in existing Google Analytics implementations. Understanding users’ behavior, tracking loyal readers, and monetizing pageviews are a few areas we want to make sure are tracked correctly, regardless of device.
You may be wondering where to begin your Google Analytics implementation on AMPs. This blog post outlines some of the key considerations involved in planning the tracking strategy for your content site. It will also help you with the tracking code you may need to use to support your business goals.
First let me start by saying that tracking content performance isn’t rocket science! It is quite straightforward if planned correctly and ahead of time. We just need to put a strategy to track all the important variables you’ll need for your content marketing campaigns (even those that you may not need today).
In this post we will illustrate how to track content websites in Google Analytics using the AMP collection library.
Strategic Planning for AMP Tracking in Google Analytics
As with any strategic planning, we should start by raising some business questions to help us design our implementation plan:
- Which content types users interact with the most (examples: Textual, Video, Audio, Infographic, Illustration).
- What kinds of topics, tags and categories interest your audience the most and hence you should write more about.
- Which authors have the most popular content.
- Which content language gives your site higher engagement and conversion.
- Which posts are performing the best. This will help you for example in selecting content to feature on the homepage’s hero banner or on your monthly newsletter.
- How far down the content page users are scrolling.
- What users do with content. (Read, Email, Print, Save, Share, Comment).
- Walled/premium content performance vs. public content.
- How much revenue each content category is generating.
- Which traffic sources and user segments (based on geography or device, as examples) are driving the most paid/premium memberships.
Tracking Content Metadata and User Interactions in Google Analytics for AMP
There are four steps to this process:
Step 1: Configure Google Analytics
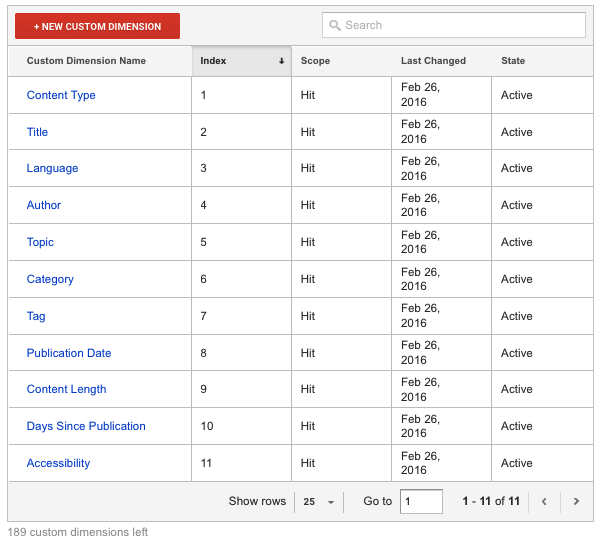
In order to record the content metadata in Google Analytics, we will need to set up a number of Custom Dimensions and Custom Metrics. Once Custom Dimensions are defined, they will appear in all reports and filters like any other default dimensions.
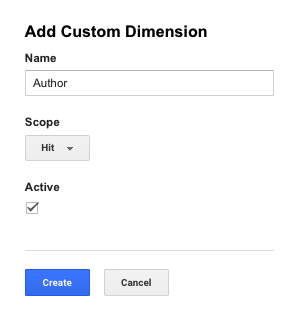
Configuring Author as a Custom Dimension
- Name the Custom Dimension and set the “Scope” as “Hit”.
- Save the Custom Dimension by clicking “Create.”
- Repeat for all variables.
Custom Dimensions Configured For Page Metadata
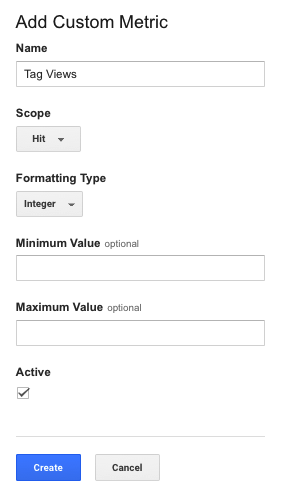
Configuring Tag Views As a Custom Metric
- Name the new Custom Metric “Tag Views.” Leave the “Scope” dropdown as “Hit,” and set “Formatting Type” as “Integer”.
- Save the Custom Metric by clicking “Create.”
Step 2: Configure your code to capture metadata information.
In order to send the metadata to GA, we’ll need to capture that information from the page.
| Content Metadata | Possible Values | Example |
|---|---|---|
| Title | < Article ‘s Title > | Tablets Are Dead |
| Content | [Textual, Video, Audio, Infographic, Illustration, White Paper] | Textual |
| Topic | [News, Money, Entertainment, Tech, Sport, Travel, Style] | Tech |
| Category | < Content Category > | Coverage |
| Tags | < Content Tags > | Gadgets, Samsung, LG, Tablet, Sony |
| Author | < Author ‘s Name > | Romain Dillet |
| Language | [English, Arabic, French, Spanish] | English |
| Publication Date | < Publication Date > | February 24, 2016 |
| Days Since Publication | [0, 1, 5, 22, 40] | 2 |
| Content Length | [Short, Medium, Long] | Medium |
| Accessibility | [Public, Private] | Public |
Step 3: Configure the Google Analytics code to read the metadata information and send it with the pageview hit that is sent when users visits the content page.
Note: Since articles usually are associated with multiple tags, send the custom dimension “Tag” and the custom metrics “tag views” with an event. The custom dimension, the custom metric and the event need to be called for every tag in the page (loop through each item in the tags array).
Sample Code for Tracking Author, Publication Date, Category, and Tags
<amp-analytics type="googleanalytics" id="analytics1">
<script type="application/json">
{
  "requests": {
    "pageviewWithCDs": "${pageview}&cd1=${cd1}&cd2=${cd2}&cd3=${cd3}&cd4=${cd4}"
	},
  "vars": {
    "account": "UA-XXXXX-Y" // Replace with your property ID.
  },
  "triggers": {
    "trackPageviewWithCustom" : {
      "on": "visible",
      "request": "pageviewWithCDs",
      "vars": {
        "title": "CampaignAlyzer nominated for 2016 Digital Analytics Association Award",
        "cd1": "Sri Chalasani",
	"cd2": "Tools",
	"cd3": "Digital Analytics Association",
	"cd4": "February 26, 2016"
      }
    }
  }
}
</script>
</amp>
Sample Code for Tracking Email Clicks
<amp-analytics type="googleanalytics" id="analytics2">
<script type="application/json">
{
  "vars": {
    "account": "UA-XXXXX-Y"  // Replace with your property ID.
  },
  "triggers": {
    "trackClick" : {
      "on": "click",
      "selector": "#emailClick",
      "request": "event",
      "vars": {
        "eventCategory": "Page Interaction",
        "eventAction": "Email"
      }
    }
  }
}
</script>
</amp-analytics>
Sample Code for Tracking Social Interactions
<amp-analytics type="googleanalytics" id="analytics3">
<script type="application/json">
{
  "vars": {
    "account": "UA-XXXXX-Y" // Replace with your property ID.
  },
  "triggers": {
    "trackClickOnTwitterLink" : {
      "on": "click",
      "selector": "#tweet-link",
      "request": "social",
      "vars": {
          "socialNetwork": "twitter",
          "socialAction": "tweet",
          "socialTarget": "https://www.examplepetstore.com"
      }
    }
  }
}
</script>
</amp-analytics>
Sample Code for Tracking Page Scrolling
Are users reading the full article or are they just reading the first few lines and bouncing? Is the intro paragraph engaging them enough to read the whole story?
The following example uses the scrollSpec attribute to send an event to GA when page is scrolled vertically by 75% of the screen height.
<amp-analytics type="googleanalytics" id="analytics4”>
<script type="application/json">
{
"requests": {
   "scrollEvent": "${event}&scrollY=${scrollTop}&scrollX=${scrollLeft}&height=${availableScreenHeight}&width=${availableScreenWidth}"

 },
"vars": {
 "account": "UA-xxxxx-y"
},

"triggers": {
"scrollPings": {
     "on": "scroll",
     "request": "scrollEvent",
     "scrollSpec": {
       "verticalBoundaries" : [75]
     },
     "vars": {
"eventCategory": "Page Interaction",
"eventAction": "Scroll Down",
"eventLabel": "75"
}
        }
     }
}
</script>
</amp-analytics>
Step 4: View Stats in Google Analytics
Now that we have everything sent to GA, it’s time to view our data and see how our articles are performing.
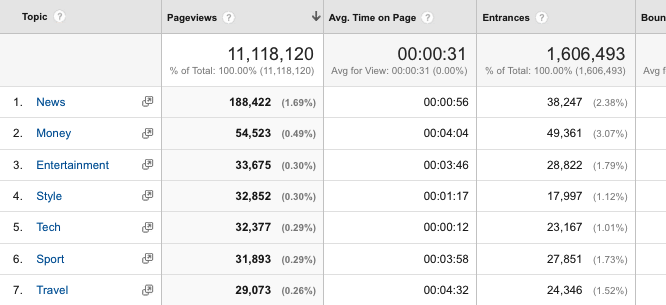
We can view data in several ways, but for the sake of illustration, we are going to look at only few reports.
Custom report showing Topic as the primary dimension
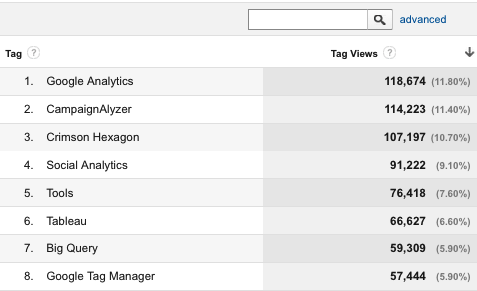
Custom Report Showing Tag Usage as a Custom Dimension
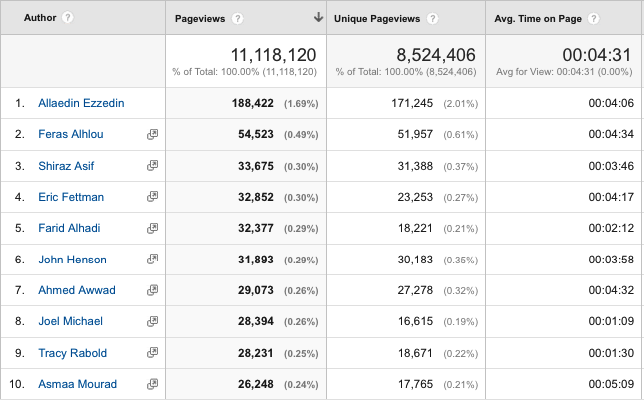
Custom report showing Author as the primary dimension
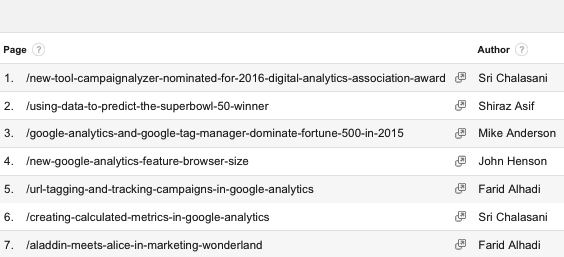
Author applied as a secondary dimension
Optimizations Based on Metadata
Let’s say that your company posts articles about travel and that the categories that you’re capturing as custom dimension values are cruises, hotels, excursions, and dining.
If your hotels pages are generating the lowest bounce rate, lowest exit rate, and highest time on page, you could consider channeling more of your writing resources towards additional hotel pages. If your excursion pages are demonstrating the highest bounce rate, highest exit rate, and lowest average time on page, you could shift resources away from the excursion pages, or you might be able to drill into individual pages within the category and observe a pattern: the pages about guided excursions are performing well; it’s the self-guided excursion pages that your readers don’t seem to like.
Once all AMP pages are tagged properly and all page elements and conversion points (micro and macro conversions) are reported to GA, it is easy to create reports (similar to the above) for other types of data that appear on your published content. Anything from author to subscriptions to categories to social shares to user interactions.
Are you a publisher? Are you AMPed? We would love to hear about your experience with AMP Analytics and excited to know what content data you are pushing into GA. Please leave a comment below.
Happy Analyzing!
![]()