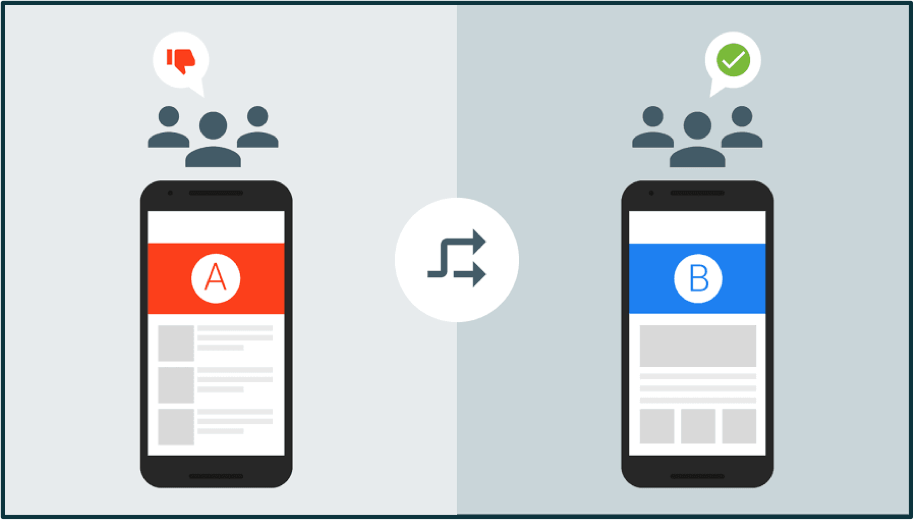
If your organization has invested resources in developing mobile apps, there are surely specific objectives that you’re aiming to achieve. A/B testing allows you to make steady gains in meeting these objectives by improving your users’ experience to make them more engaged with your app and to get more new users.
Common design changes include the look and feel of a button, the background of a screen, calls to action (such as one designed to get people to try out a new feature), or the number of steps of the on-boarding flow.
But you have to be careful!
To make sure you’re making the most informed decisions, you need a little help from data. You need to use A/B testing.
A/B testing lets you release two or more versions of elements within your app simultaneously among randomly selected users to find out which version truly is more successful at getting the results you want.

A/B testing gets you from a place where you’re saying, I think, or I feel, or I guess, to a place where you’re gonna say, I know.
Now, Firebase (Google’s Mobile Platform) provides the ability to perform A/B testing experiments with Firebase Remote Config to test anything that happens within your app and with Firebase Notifications to test notifications that you’re sending to your users.
And like Google Optimize, Firebase A/B testing now measures the results of your experiment using Bayesian statistics.
Creating an Experiment with A/B Testing
Before you go to your Firebase Console to create your first experiment, you have to make sure you have the latest libraries (Android and iOS) of Firebase Core, Remote Config and Notifications installed.
Now, go to Firebase Console and click on Notifications or Remote Config in your left hand menu. Then, select A/B Testing, then click on the “create experiment” button:

Give your experiment a name and description. Select your app and determine the percentage of your target users:

Now we go to the meat of the experiment: the variants.
This is where we decide for each of the variants, which different Remote Config values they’re going to receive or the different values of the Notification message:

The last step is to tell Firebase A/B testing your goal for this experiment:

In this step, you are going to tell Firebase A/B testing what your goal is for this experiment. You can choose one from the built-in objectives like “Notification open” or one of your Firebase analytics events (built-in, custom and conversion events) like ecommerce_purchse.
All of the above screenshots are taken from a Remote Config experiment. In the Notification experiment, you will go through the same steps. In the Notification experiment set up, you can customize the notification message as well as when you want to send this notification:

Testing Your Experiment
After setting up the experiment you can review it. To make sure everything looks good before clicking on the start experiment button, you can validate your experiment on a test device.
Just grab the instance ID token of your app and select which variant you need to test:

Understanding Experiment Results
If you’re going to run an experiment with a few test devices, that’s not really going to be enough to get you meaningful results.
So, you need to run your experiment on a real app in production with a real audience and wait for a week or two to let A/B testing to tell you which variant is the winner to make your changes according to this results.
You can access the Firebase demo project to review an A/B testing experiment.
The experiment overview section will tell you the total users and if there is a leader found or not:

The Improvement overview section gives you a summary of how each of your experiment variants are performing or have performed compared to your control group (the default value) based on your chosen factors in the experiment:

In the third section you will find more details about the clicked metric in the improvement overview section:

Finally, I’d like to encourage you to watch this video series to dig deeper and to contact Cardinal Path for support with your organization’s testing program..
Happy Testing!


