In web analytics Bounce Rate is a popular (loved and hated) metric we like to throw around in reports, dashboards, and some conversations where we want to impress.
Google Analytics, of course, reports on bounce rates and does a great job at it. Having said that, It turns out that Bounce Rate can be a sneaky metric that can change dramatically depending on the report you’re working with. But let’s define it, first. Google Analytics defines bounce rate as
“the percentage of visits that go only one page before exiting a site.”*
The definition in this section oversimplifies things a little and, personally, I find it a bit misleading. That’s because for more advanced implementations and analysis this definition can throw things off (see end note).
There are a couple scenarios where the reporting bounce rate can be a bit deceiving. But in this post we’ll take a look at one popular confusing scenario.
Many of us like to create Advanced Segments to analyze sections of a site – I’m sure you do too. It is very likely you have created an advanced segment like the one below.
Once you’ve done this, you probably analyze different metrics, including our dear Bounce rate.
Careful! Let’s see what happens to the Bounce rate when we do this across a few reports. (Assume all reports have the same time period and are in the same profile.)
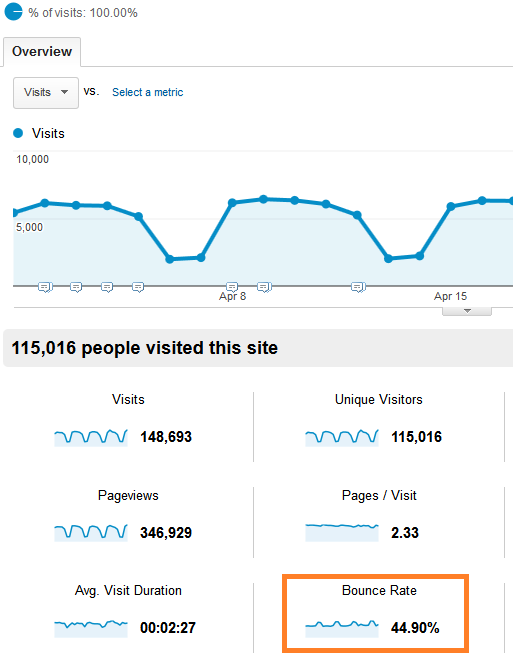
Let’s first take a look at our content overview with no segments.
(Common Question: what defines a good bounce rate? Answer: in most cases, your own historical bounce rate.)
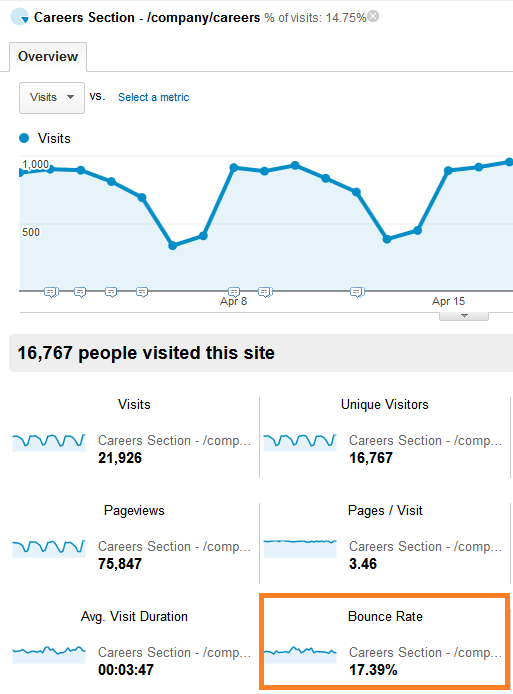
We’re looking at a bounce rate of 44.90% for the unfiltered data. Ok, now that we know our bounce rate without any filters, let’s take a look at what happens to our traffic when we apply the Advanced Segment mentioned before.
Awesome! Now we can conclude that the bounce rate for this section is 17.39%. Right?
…not so fast!
What if we looked at the bounce rate for this section in a different way? If we go to the Landing Page report and apply a filter (not an Advanced Segment) to this table; should the bounce rate be 17.39%? After all, that’s what management and my team will be assuming.
But…. “WHAT?! This doesn’t make sense!” you would say… And yet, you’ll likely find the same scenario if you try it on your reports.
What’s happening here?! Does it make sense? Well, yes and no.
The bounce rate makes sense. The part that doesn’t make sense is that we don’t have visuals queues hinting about how these bounce rates are calculated.
At the moment we have two different bounce rates for the same section of the site. One through a Advanced Segment set to include a “Page” dimension (17.39%), the other on our regular Landing Page report with an inline filter (35.32%).
(Do you get an idea where difference is yet?)
The difference here is that we’re using the Page dimension for one segment and the Landing Page dimension for the other; and these work very differently.
Having an Advanced Segment set to include a “Page” dimension takes all visits that include the page criteria we defined, regardless of where they start. In other words, If the visitor started the visit on a page outside of our criteria but later visited a page that matches our Advanced Segment, the segment will still include that visit.
On the other hand, this same scenario would be calculated differently in the Landing Page report. The Landing Page report would only include landing pages. If we filter these landing pages we can see only visits that started in our section of interest. This scenario is more aligned with what most people would assume while analyzing bounce rate.
The number of visits landing on our section (excluding those who landed on the home page, for instance) is going to be much less. The bounces, nonetheless, should be very similar.
Less visits with a similar number of bounces is going to mean a higher bounce rate, unfortunately. (Bounce rate = Bounces / Visits)
To better understand these numbers, let’s create a simple Custom Report that includes bounces and see what Google Analytics is doing. (Here’s the custom report if you’d like to use it: https://goo.gl/zyTTQ)
First, look at the report with the page-based Advanced Segment enabled.
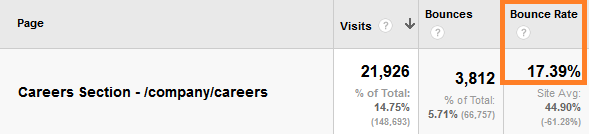
Our Bounce Rate is 17.39%, which we can confirm by dividing Bounces by Visits.
Again, this segment includes those visits that started on the homepage and navigated to the “/company/careers” section. A significant amount of visits counted in this calculation that do not speak to my analysis.
Now that we know the formula for bounce rate, we know that this increased visit count also means a lower bounce rate – but a little deceiving for my purposes.
Now let’s change that advanced segment to include Landing Page instead of Page. This will tell Google Analytics that we only want our segment to include visits that start on the pages that meet our criteria.
Once you apply this segment you can go to your content or landing page report, it really makes no difference. But let’s keep our sights in the custom report. That way you can see we’re still talking about Bounces divided by Visits.
Now we can see our bounce rate is higher. (Aww…). Let’s accept that this this bounce rate is not wrong, just calculated differently.
So, which one should you use?
Every analysis should serve a business objective. I wouldn’t be able to say which one is better than the other for your case. What’s more important is that we understand the logic behind the calculation.
I’m typically in favour of letting the tool do what it needs to do and not second guessing complex calculations. But every now and then, to make the right decision, we need to take a second look at what exactly the tool is telling us.
Having said that… if we were trying to measure the performance of the landing pages (something we commonly do for paid search, conversion testing, etc.) we might want to consider a landing-page based segment. This segment is a better representation of those visitors who landed on those pages and did not visit any other pages or, if you use Events, interacted with your site.
Have you run into this scenario before? Let us know about your experience!
For a while, traffic from AI platforms like ChatGPT, Gemini, and Claude lived in an…
Our team is heading to San Francisco March 3-5 for RampUp 2026. We'll be meeting…
The rise of browser-based Opt-Out Preference Signals (yes, OOPS) is quietly reshaping online consent experiences.…
This website uses cookies.