If you haven’t yet taken advantage of the Plot Rows feature in Google Analytics, this demo provides an intro to this useful feature that allows you to dynamically chart individual rows in the main overtime graph. At the same time, we consider a limitation of this feature, namely, that for metrics such as users, sessions, and pageviews, which are expressed as whole numbers rather than percentages or ratios, it can be hard to decipher variations because the trend lines are plotted relative to the total metric for all rows.

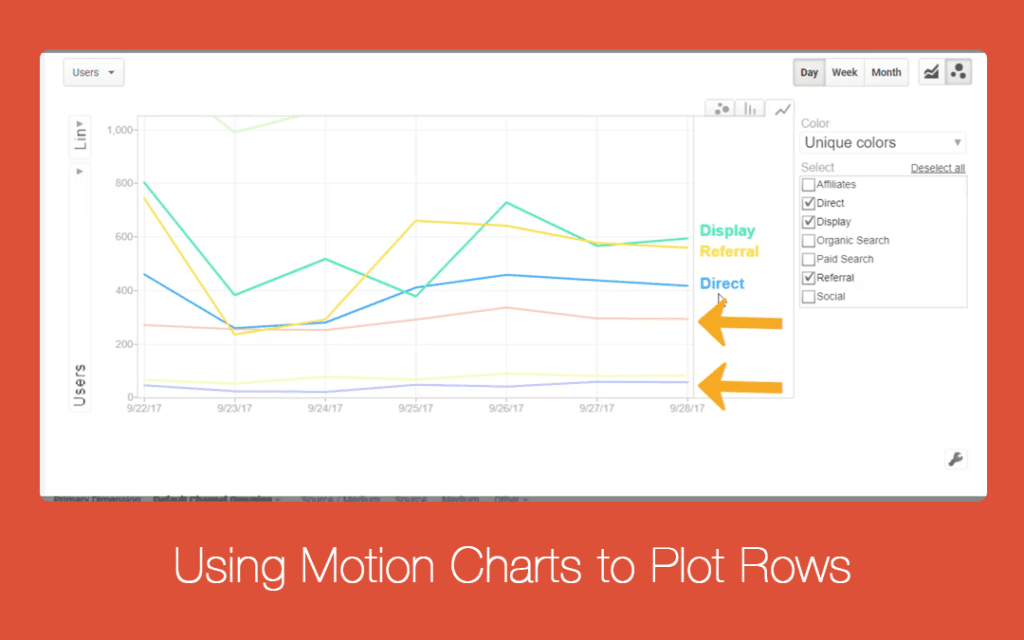
At the core of this demo, we explore Google Analytics motion charts, which offer a solution for removing the total metric from the display, thus allowing the individual rows the amplitude they need for easy interpretation. We also review logarithmic scale for the Y axis, which can provide even greater clarity for the individual trend lines.

To wrap up, we briefly discuss Data Studio, and why in some cases we still might want to opt for row plotting with motion charts within the Google Analytics interface.

[videoembed url=”https://youtu.be/NfDSSdakouw”]

Message Sent

Thank you for registering.

Cardinal Path hosted a live session to connect with you and answer all your questions on Google Analytics.
Get all the expertise and none of the consultancy fees in this not-to-be-missed, rapid-fire virtual event.

Thank you for submitting the form.

Thank you for submitting the form.

Message Sent

Thank you for registering.

Message Sent

Thank you for registering.

Message Sent

Thank you for registering.

Message Sent

Thank you for registering.

Message Sent

Thank you for registering.

Message Sent

Thank you for registering.

Message Sent

Thank you for registering.

Message Sent

Thank you for registering.

Message Sent

Thank you.

Click here to download access the tool.

Message Sent

Thank you for registering.

Message Sent

Thank you.

Message Sent

Thank you.

Message Sent

Thank you

Message Sent

Thank you

Message Sent

Thank you.

Message Sent

Thank you

Message Sent

Thank you.

Message Sent

Success!
Your message was received.

Thank you.

Thank you for registering.

Cardinal Path is continuing with its series of free training. Next we are conducting training on Google Data Studio. Check it out here.

Message Sent

Thank you for registering.

Thank you for your submission.

Your request has been submitted and a rep will reach out to you shortly.

Message Sent

Thank you for your interest.

Thank you for registering.

You should receive a confirmation email from GoToWebinar with your unique webinar login information. If you do not receive this email or have trouble logging in to the event, please email asmaa.mourad@cardinalpath.com.

Thank you for subscribing!

You're now looped into the world's largest GMP resource hub!

Thank you for your submission.

Thank you for your submission.

Thank you for your submission.

Thank you for your submission.

Message Sent

Thank you for registering.

Message Sent

Thank you for your submission.

Thank you for your submission.

Message Sent

Thank you for registering.

Thank you for registering.​

Paid media spend by Government websites increased a whopping 139% YoY in 2020.

2020 Online Behavior Live Dashboard

Message Sent

Thank you for registering.

Message Sent

Thank you for registering.

Message Sent

Thank you for registering.

2020 Online Behavior Live Dashboard

Thank you for your submission.

Message Sent

Thank you for registering.

Message Sent

Thank you for registering.

Message Sent

Thank you for registering.

Message Sent

Thank you for registering.

Message Sent

Success! Thank you
for reaching out.