What is it?
Google Analytics has four levels of User Permissions:
- Manage Users
- Edit
- Collaborate
- Read & Analyze
Three are very straightforward. But…collaborate? Most people I’ve collaborated with really don’t know what “collaborate” means:
Collaborate: Can create personal assets, and share them. Can collaborate on shared assets, for example, edit a dashboard or annotation. Includes Read & Analyze.
Source: User Permissions in Analytics Help
Collaborate means that
- Any Google Analytics users can use assets you create. They don’t need to import the configuration into their individual Google Analytics accounts.
- Users with Collaborate permissions can edit any shared asset.
What Assets Are
In Google Analytics, assets are configurations that individual users create, e.g.
- Custom segment
- Annotation
- Dashboard
- Remarketing Audience…
In the View section of the Admin panel, Personal Tools & Assets give options for setting up these mysterious “assets”.
Here’s what can be shared with Collaborate permission.
Dashboards & Collaborate
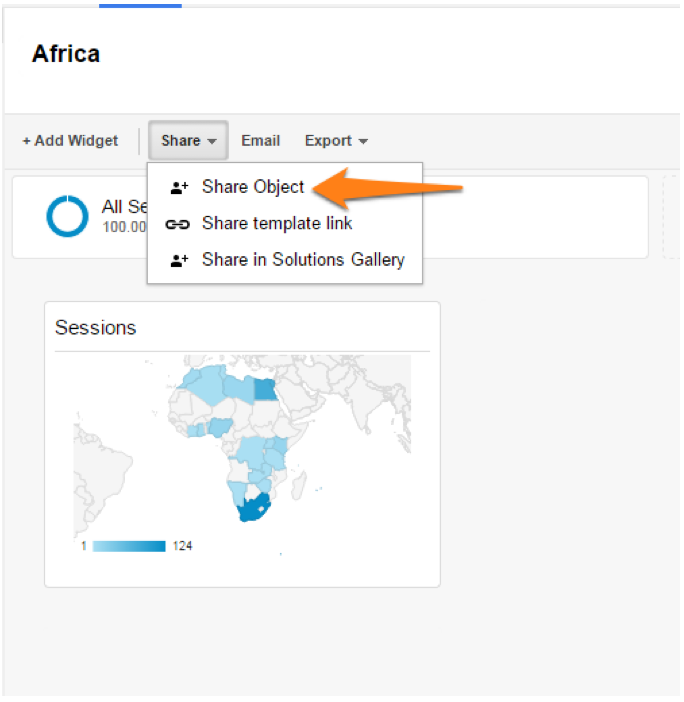
To share a dashboard, choose Share Object from the Dashboard itself:
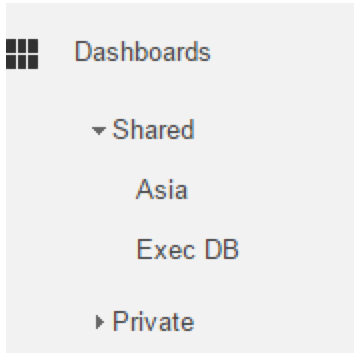
Share Object allows other users to access the dashboard in Dashboards -> Shared in the left sidebar. This Google Analytics user can access the Asia and Exec DB dashboards.
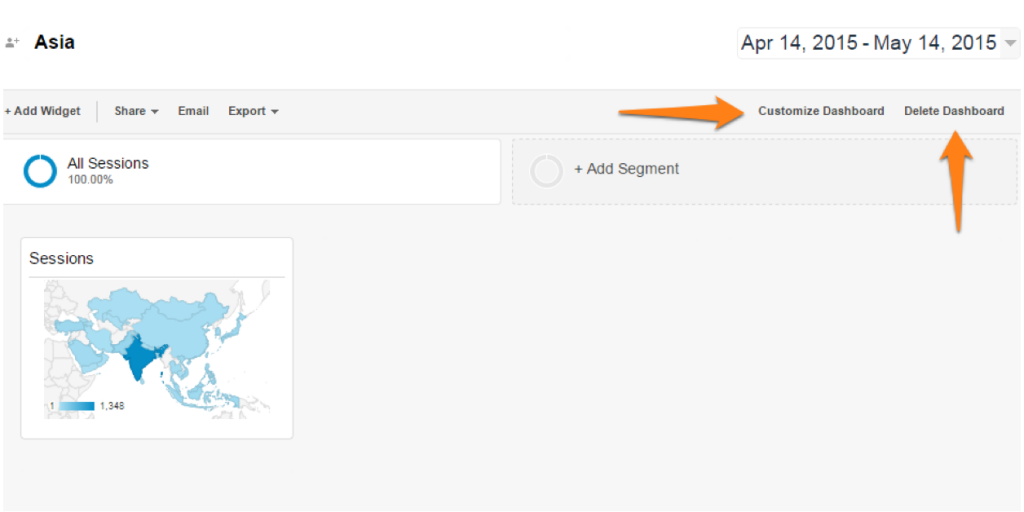
In addition, users with Collaborate permissions can edit any Dashboard that has been shared with Share Object, including deleting it. For example, I could change the name of the Exec DB dashboard to something easier-to-read and not redundant, like Executive or better yet, Marketing Executive.
Users with Read & Analyze permission won’t see these options for Shared dashboards:
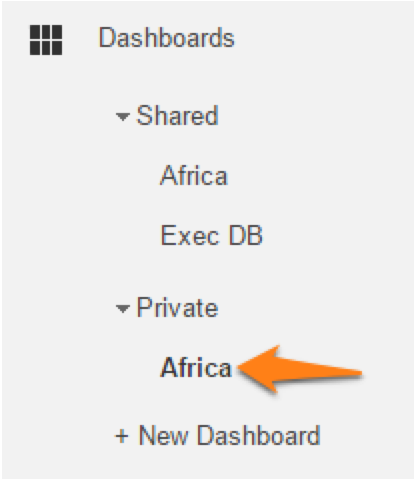
When you use Share Object to share a dashboard, the original dashboard remains in your Private folder, so if another uses changes or deletes the shared dashboard, your original dashboard remains unchanged (assuming you’ve not changed or deleted it).
If a user is deleted from the View or if their permissions change to Read & Analyze, the Shared Dashboards she created remain in the Shared folder.
Custom Segments & Collaborate
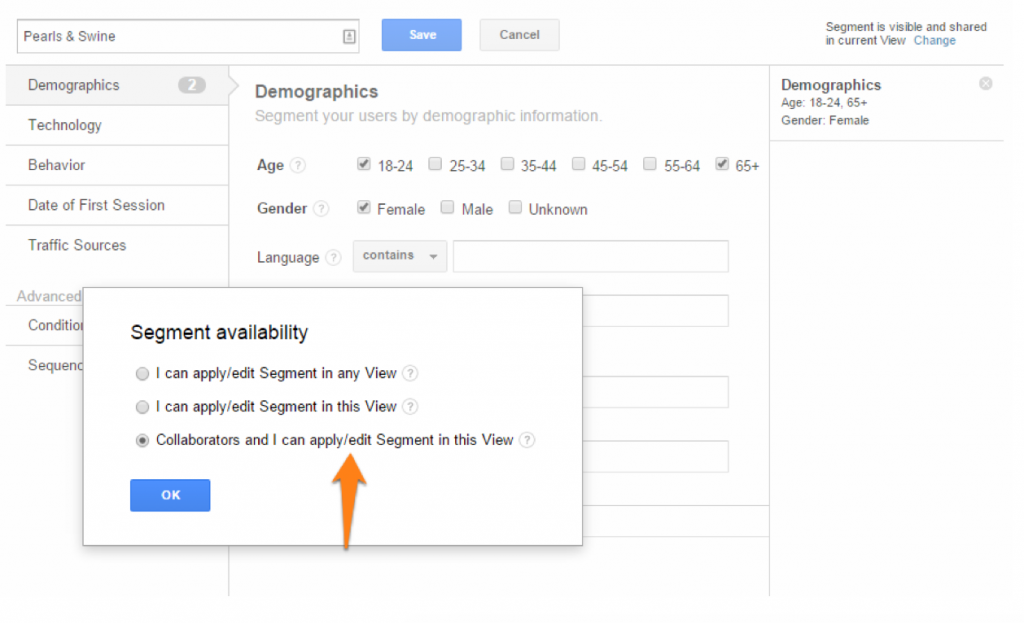
Similar to using Share Object to create a shared dashboard above, Google Analytics users with Collaborate permission can designate a Custom Segment as shared from the Create Segment panel or from Share Assets in the Admin panel for the relevant View.
This is called Segment Availability and it’s quite small in the Create Segment screen. It appears in the upper right of the screen when you are creating or editing a Custom Segment.
When a user with Collaborate permission changes the segment availability to Collaborators and I can apply/edit Segment in this View (see below),
- Other users with Collaborate permission cannot edit or delete the segment.
- Read & Analyze users can apply, but not edit or delete the shared segment.
Trying to delete or edit another Collaborate user’s shared segment resulted in the Resource is not available message:
Annotations & Collaborate
Annotations are tremendously useful. Here’s where Annotations live in Google Analytics.
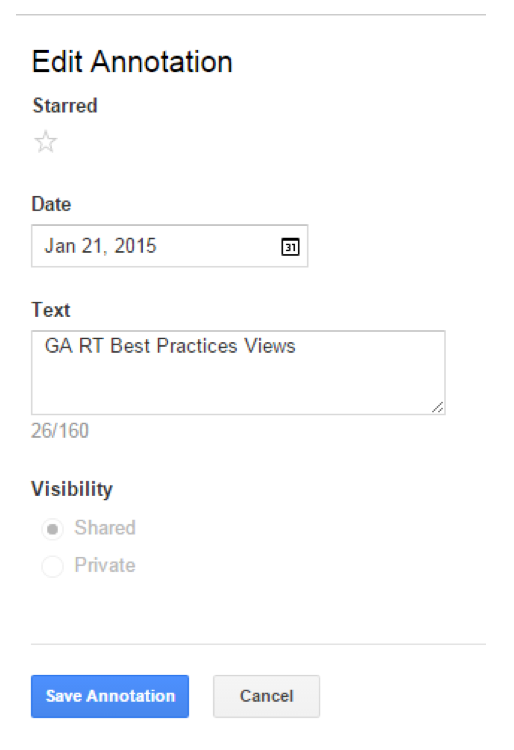
Annotations also live in the Admin panel for each View. If Visibility has been set to Shared — from either Create New Annotation or from the Annotations screen in the Admin panel for the relevant View (see below), then Annotations can be edited or deleted by other users with Collaborate permissions from the Admin panel.
Collaborate users can edit other users’ shared annotations, but cannot delete them:
Unsampled Reports (Google Analytics Premium) & Collaborate
Google Analytics announced a new capability related to Collaborate permission. This change applies only to Google Analytics Premium accounts and will be rolled out to Premium accounts through end of June 2015. Among the the new capabilities related to Unsampled Reports:
- Users must have Collaborate permission to create unsampled reports. You may need to modify permissions for some Read & Analyze users (current requirement) to ensure they can continue to create unsampled reports.
- Unsampled reports will be automatically shared with all users with access to the View the report was created in.
My cat, Samoa, collaborates.
Sharing Assets versus Collaborating
Any Google Analytics user – even those users with only Read & Analyze permission – can share assets via a link. When another user clicks that link (while logged into Google Analytics), those assets will be imported into her Google Analytics login.
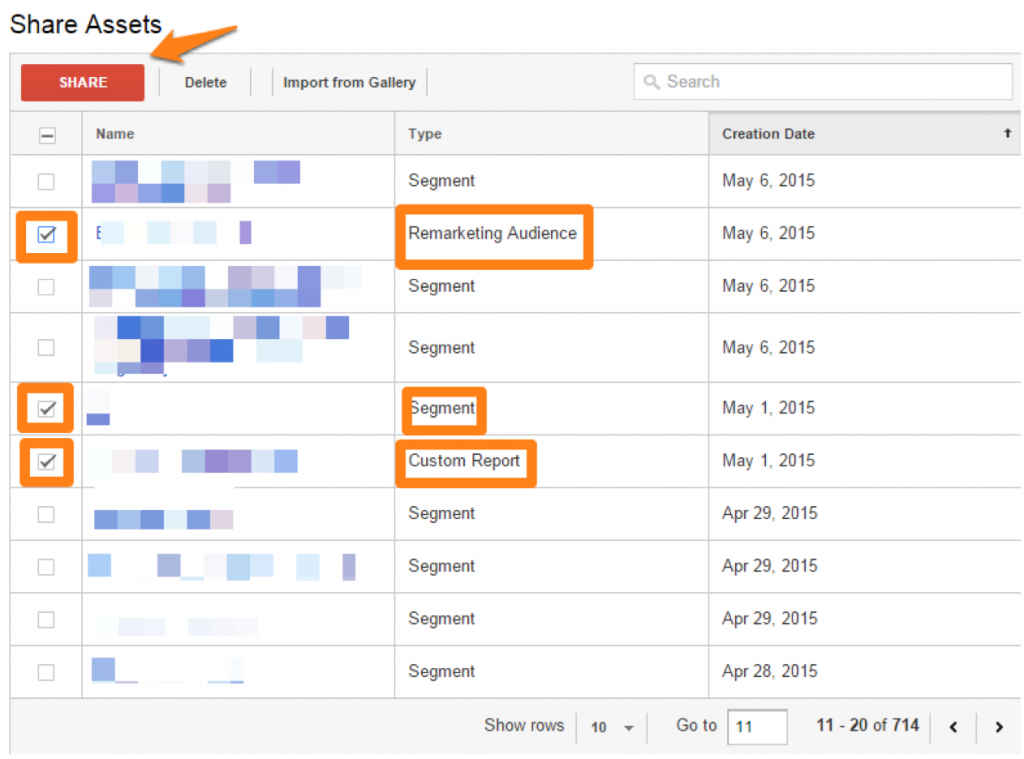
In addition to getting configuration links from the Customization and Custom Segments screens, Share Assets from the Admin panel allows you to share multiple assets — including different types of asset with one link (segments and custom reports together!!).
Note on Setting User Permissions
User Permissions are set at the Account, Property or View level. The settings in this post all happen at the View level. Some assets, like custom segments, can be made available in more than one View.
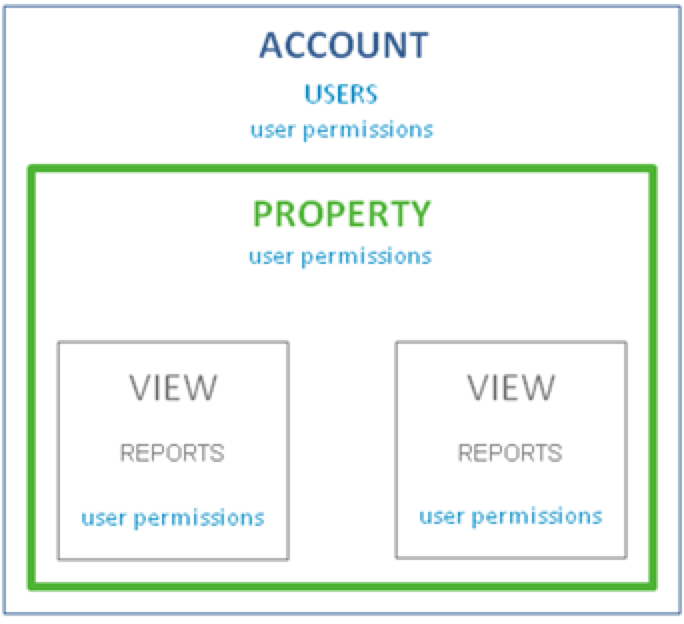
To learn more about creating multiple views for a Google Analytics property, see Best Practices for Views in Google Analytics.
