In an earlier blog post I covered how to measure user behavior and segmenting content for publishers on Accelerated Mobile Pages. Ever since the post, we were asked many times on how to track articles that are associated with multiple tags and categories in Google Analytics.
Unfortunately, the solutions that I see circulating in the Internet suggest that if an article or a content page is associated with multiple categories, a single custom dimension should be fired with the content pageview. And all categories that are associated with the page will be concatenated and separated with a delimited (for example: holidays-mothers_day-craft-gifts) and then get sent as a one string.
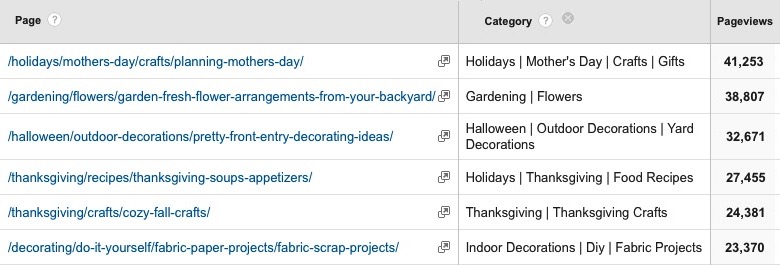
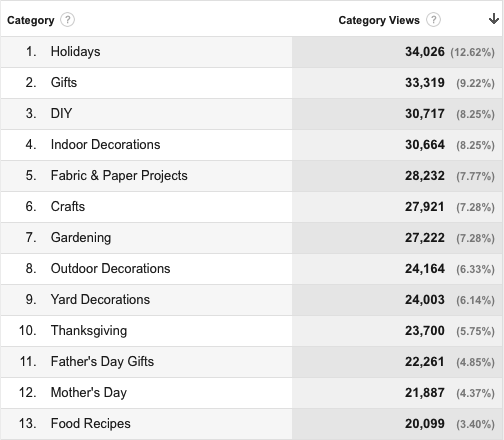
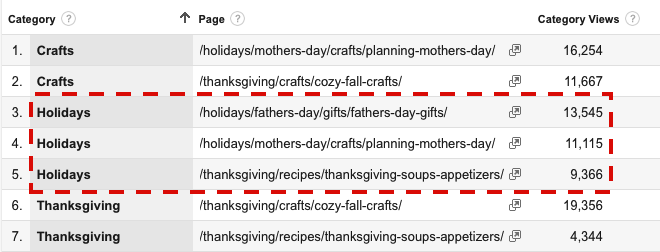
If we look at the sample report above, you will see an obvious readability and usability issues about this solution:
- This report shows us how pages with multiple tags perform, but it is very hard to analyze the performance of each category by itself.
- For category analysis, you will need to export the data outside GA (ex. Excel sheet), clean all entries, and then look at categories and their corresponding pages.
Since i’m a big fan of constructing solutions that provide reporting and ease of analysis within the GA interface, where possible, and since the purpose of this exercise is to analyze page categories, we need a solution that is category-centric where page categories can be tracked independently from the pages that they are associated with but also associate with their corresponding pages as needed in reporting.
(For a multi-tag analysis in BigQuery, see Big Data for Publishers by Hazem Mahsoub.)
Suggested Solution:
Create a custom dimension to track each page category by itself and a create custom metric to track how often each individual category is viewed. we will need to loop through each item in the categories array and fire an event for each item along with the “category” custom dimension and “Category Views” custom metric.
This will empower analysts to look at categories at the aggregate level as well as in a granular level.
Step 1: Configure Google Analytics
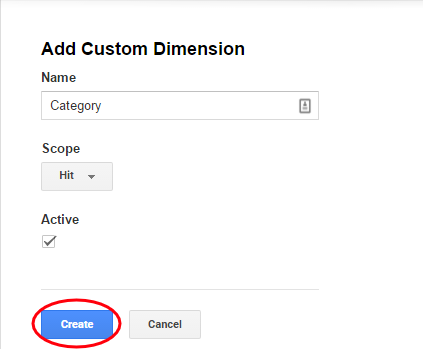
Set up a Custom Dimension:
- Click on New Custom Dimension
- Name the Custom Dimension as “Category”
- Set the “Scope” as “Hit”.
- Save the Custom Dimension by clicking “Create”.
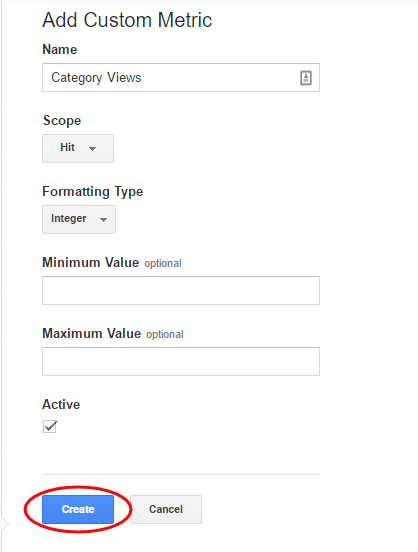
Set up a Custom Metric:
- Name the new Custom Metric “Category Views”.
- Leave the “Scope” dropdown as “Hit”.
- Set “Formatting Type” as “Integer”.
- Save the Custom Metric by clicking “Create”.
Step 2: Configure the Google Analytics code to read the article categories and send them with an event hit that is sent when users browse the content page.
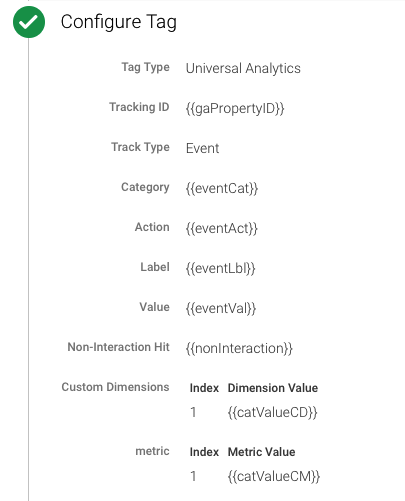
Note: Since multiple tags are associated with our articles, The “Category” custom dimension and the “Category views” custom metric will be fired with an event for every category in the page (loop through each item in the tags array).
Sample code for tracking categories
(function(i,s,o,g,r,a,m){i['GoogleAnalyticsObject']=r;i[r]=i[r]||function(){
(i[r].q=i[r].q||[]).push(arguments)},i[r].l=1*new Date();a=s.createElement(o),
m=s.getElementsByTagName(o)[0];a.async=1;a.src=g;m.parentNode.insertBefore(a,m)
})(window,document,'script','//www.google-analytics.com/analytics.js','ga');
ga('create', 'UA-12345678-1', 'auto');
var pageURL = '/holidays/mothers-day/crafts/planning-mothers-day/';
var pageTitle = 'Planning Mother\'s Day';
var categoryValue = ['Holidays', 'Mother\'s Day', 'Crafts', 'Gifts'];
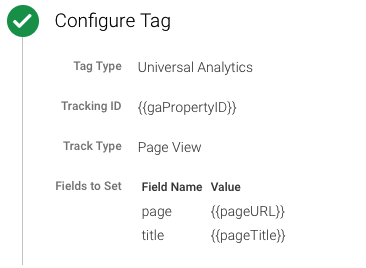
ga('set', {page: pageURL, title: pageTitle});
ga('send', 'pageview');
for (var i = 0; i < categoryValue.length; i++) {
setTimeout(myFunction(i), 3000);
function myFunction(i) {
ga('send', 'event', 'Custom Dimension Event', 'Blog Post Categories', 'Blog Post Categories', {nonInteraction: true, 'dimension1': categoryValue[i], 'metric1': 1});
}
}
Note #1: Modifying page URLs
Many publishers and content websites use Single Page Applications to deliver much faster-loading content without requiring a full-page load.
In these cases usually the page URL you want to send to GA and associated with all Event hits is different from the URL that appears in the browser’s address bar. We want to make sure every Custom Dimension, Custom Metric and Event hit get sent with the correct page URL. In the above sample code, we updated the page field on the tracker instead of passing it in the send command. Setting it on the tracker will ensure the page URL is used for all subsequent hits.
Note #2: Non-Interaction Events
In GA a bounce is defined as a session with a single interaction hit. Event hits are by default considered an interaction hit, which means that it is included in bounce rate calculations.
In our code, we set the value of the final boolean parameter “nonInteraction” to true to make the sent events non interaction hits in order not to impact the bounce rate calculations. Now our sessions that contain a single page view with non-interaction events fired for category tracking will be treated as bounce sessions as normal.
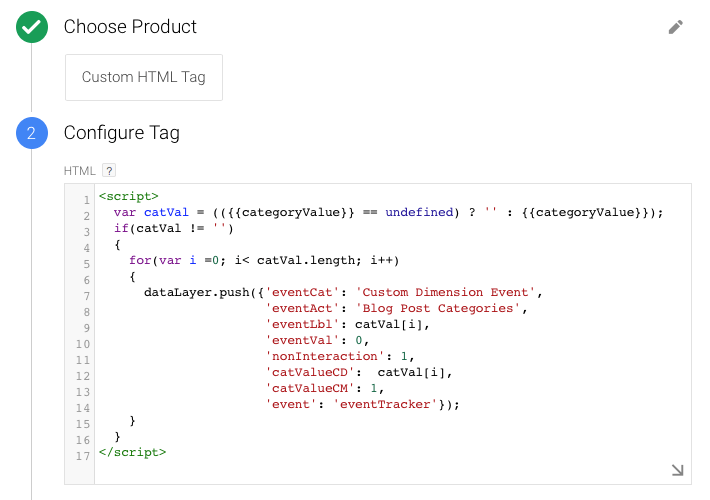
Note #3: Google Tag Manager
If you’re using Google Tag Manager for Google Analytics deployment, follow the following instructions:
- Add the following snippet of code to the head of your content page or elsewhere above your container snippet (update the data layer variables with the correct metadata information):
dataLayer = [{ 'pageURL': '/holidays/mothers-day/crafts/planning-mothers-day/', 'pageTitle': 'Planning Mother\'s Day', 'categoryValue': ['Holidays', 'Mother\'s Day', 'Crafts', 'Gifts'] }]; ... - Configure the GTM tags to receive the data layer values and fire the proper hits to GA.
Step 3: View Stats in Google Analytics
Now that we have everything sent to GA, it’s time to view our data and see how our articles’ categories are performing.
Since custom dimensions don’t appear in standard reports as a primary dimension, create a simple custom report with the “Category” dimension and the “Category Views” metric.
Finally: Measure and optimize
In our example that we used in this post, Better Homes and Gardens website offers extensive information on decorating, building and remodeling, crafts, entertaining, cooking, and gardening.
If crafts pages, for example, are generating high time on page and more user engagement (ex. social shares, comments, paid subscriptions, purchases…), business owners may consider investing more writing resources towards additional crafts ideas. And if cooking articles are leading to high bounce rate, high exit rate, and low average time on page, resources may get shifted to write on other more engaging topics.
It is important for analysts to keep in mind and before taking any drastic actions to drill into individual pages within the category to determine which specific articles are well performing or underperforming for the topic in question. Looking at aggregate numbers of the categories performance is just one step of many that we should take before we make any site optimization actions.
Happy Analyzing!
![]()