 The average time spent by visitors on your website is four minutes. Is this good? Or is this something to be worried about? You begin to evaluate the time spent per visit and asked yourself questions such as:
- Is this enough time to complete an e-commerce transaction?
- Are visitors reading enough quality content in that four minutes that will motivate them to subscribe to the email list?
- Are visitors getting enough information for interest in the Contact Our Sales Team form?
And while all of these concerns may be valid, it comes down to a simple plan of evaluation and determining exactly what information you want to gather in order to reach a given outcome. Time-onsite metrics can often be very misleading when the data is viewed in aggregate, and no segmentation is applied. And the metrics are even more misleading when used to make site optimization decisions. What is missing from the standard conversion reports is a metric I believe is very important for analysts to have in order to accurately optimize the conversion funnel based on visitor’s behavior and need. This metric is “Conversion Duration” which I define as, “the time is takes a user to complete a purchase or a Goal from a defined starting event.”
I am currently aware of two e-commerce reports that are available today in Google Analytics (GA) to time track a purchase. In my humble opinion these two amazing reports (Days to Transaction and Visits to Transaction) still lack three main features:
- They are limited to the e-commerce transactions and cannot be applied to track conversion time of any other micro or macro conversions (i.e. form submission, email subscription, enrollment application, etc.)
- They are not applied at the session level, so we can’t tell how much time (in seconds or in minutes) a particular Goal takes to be done during the same visit.
- They are applied for the last campaign only which make these metrics less robust and tell a very partial story.
So now, the question is, how do I calculate this metric?
- First Things First – Determine your Goals
 Whether the purpose of your website is lead generation, e-commerce, content or media, you must first define goals in your analytics tool. Do this in order to track conversions and also to track the time users take to make an action.
A Goal conversion can be a variety of things, depending on what your desired outcomes are. It could be an event registration, whitepaper download, form submission, video completion, or a product purchase. In your analytics tool you’ll be able to see the conversion rates and number of completions for each Goal you have set up. (Read more here about Google Analytics Goals.)
While tracking the number of Goal conversions is the basic metric for measuring how well your site fulfills your business objectives, other metrics need to be associated with the conversion rate to deeply understand the customer behavior both before and after the conversion. - Define your Starting Point
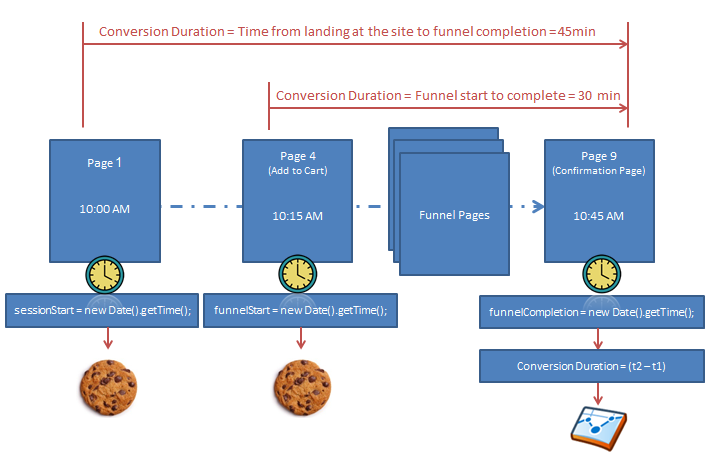
In order to accurately track the time is takes visitors to make it through a given process that you set for them, we need to define the starting point. This can be entering first page of a six-page application form, or when they reach the Add-to-Cart page for an e-commerce funnel, or even the Contact Us page. Regardless of the Goal that you are trying to track, make sure the starting point is an event that all visitors are required to go through in order to complete the conversion. - Develop Metric Calculations
Now after defining the starting and final conversion points, we need to set a timer between the two points. This Conversion Duration metric is calculated using the following simple equation:Conversion Duration = (t2 – t1)
 Whether the purpose of your website is lead generation, e-commerce, content or media, you must first define goals in your analytics tool. Do this in order to track conversions and also to track the time users take to make an action.
 In order to accurately track the time is takes visitors to make it through a given process that you set for them, we need to define the starting point. This can be entering first page of a six-page application form, or when they reach the Add-to-Cart page for an e-commerce funnel, or even the Contact Us page. Regardless of the Goal that you are trying to track, make sure the starting point is an event that all visitors are required to go through in order to complete the conversion.
Where:
- t1 = The timestamp of the first success event (i.e. landing page, add-to-cart, about-us page, etc.)
- t2 = The timestamp of the second success event (i.e. form submission, thank you page, transaction confirmation page, application confirmation page, etc.)
How to Track the Conversion Duration in Google Analytics
 While there are various ways to report the calculated metric to GA, in this post we will use the relatively new feature, User Timings, to pass the period of time spent in the conversion. With the new introduced feature you can track and visualize user defined custom timings about websites. I will provide you with the code needed to capture the conversion duration.
The easiest way to implement this is to create a timestamp at the starting point and create another timestamp at the completion of the Goal. Then, we calculate the difference between both timestamps and pass it to GA.
Here’s the process:
- Create a timestamp at the defined starting point.
t1 = new Date().getTime();
- Save the timestamp in the cookies or in the backend.
- Create a timestamp at the end of the conversion.
t2 = new Date().getTime();
- Calculate the time duration from start to the Goal completion. (In GA the time difference between the two timestamps is in milliseconds)
Conversion Duration = (t2 – t1) = funnelCompletion – funnelStart;
- Fire the _trackTiming method to track the enrollment duration in GA. (Read more here about _trackTiming)
_gaq.push([‘_trackTiming’, ‘Conversion Duration’, ‘Product Purchase’, timeSpent, ‘Product 1’, 100]);
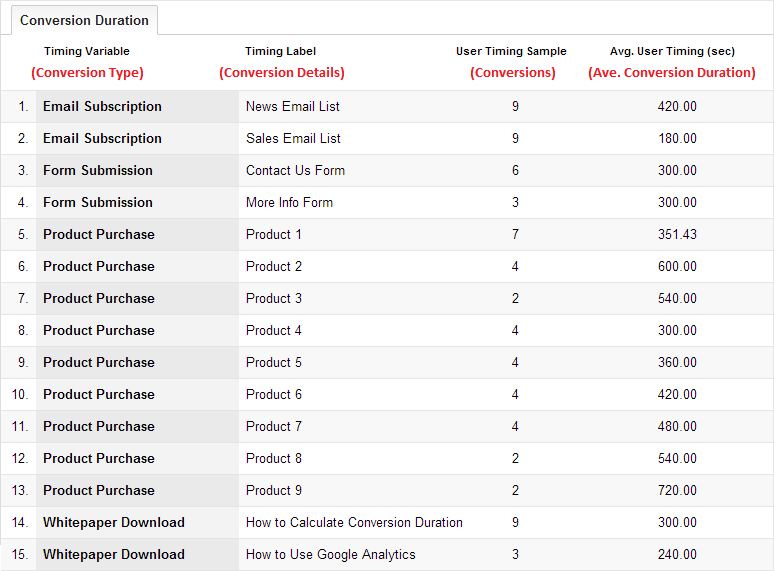
Once this data is collected, the report will consist of the Conversion Duration metrics as well as the number of Conversions, as seen below.
Go to Content > Site Speed > User Timings to see your data.
So there’s our recommended process for developing the metrics and calculate tracking using Conversion Duration in Google Analytics. This will provide you with the steps to reach your business goals when it comes to determining the passing period of time in site conversions.
We would love to hear your feedback on how you’re planning to utilize this method to work for you! Please share your thoughts with us and the analytics community 🙂
![]()