
Organic traffic performance for e-commerce sites.
So, you have an e-commerce site, right? And you wan’t to optimize it for search engines. Well then, let’s play a little questions and answers game.
You know how much organic traffic is coming, right? That was easy, sure you do.
You know how much of it is branded and non-branded organic traffic, don’t you?
- Yes – Great! You are in a good position to start evaluating your SEO.
- No – Bad! You are not doing any SEO or you are doing it wrong.
Do you know how much your organic non-branded traffic is converting?
- Yes – Fantastic! Terrific start, but keep on doing it right to win the SEO races.
- No – Disaster ahead! Why would you invest in SEO, if not for conversions?
Last one. Do you know if your organic traffic volume and its conversion rate are low or high compared to other e-commerce sites?
- No – I don’t care, I always want more! Ok, good attitude
- No – but I would like to know. Honest at least
- Yes – (ummm, are you working for a big agency or web analytics company?)
SEO benchmark
We don’t usually have an idea if the numbers we see while analyzing our SEO efforts are above or below average, so this is the topic of this article. We want to bring some light to this question.
There are quite a lot of different types of eCommerce site. Some with well known brands selling their own goods, some the opposite. Vertical e-commerce stores may offer few types of goods while more horizontal ones will sell electronics to pet care products – and everything in between. Some online shops sell tons of bargains and others, the opposite: a few selected and expensive products.
We won’t count any sites selling flight tickets, hotel rooms or pizzas, just ones everybody recognizes as the typical online shop.
Under this eclectic landscape it is not accurate to compare yourself against an average, but it is better than nothing, and this is why minimum and maximum numbers are also included in the chart below, to provide a bit more of context.
The numbers you see are coming from the analysis of a bunch of sites whose only common feature is that they are all e-commerce sites. Adding more sites to our sample may change the min. and max. values, but would not affect the averages.
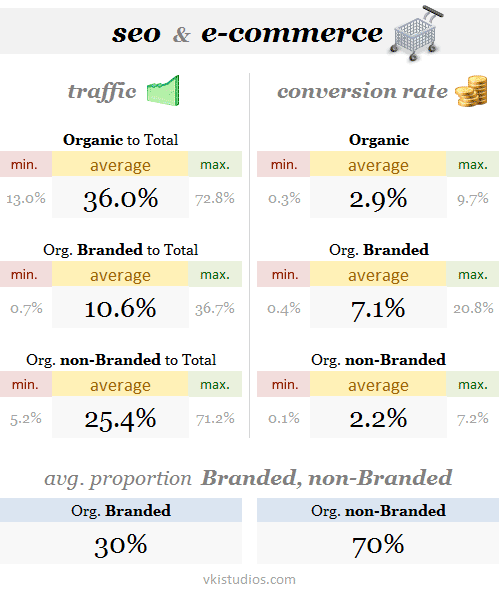
E-commerce sites organic traffic
On average, organic traffic is 36% of overall traffic. If we segment this some more we see that 10.6% is the average for branded organic, with 25.4% for non-branded.
Obviously in a situation where the brand of the site holds little sway, domains with keywords in them, such as ‘cellphoneaccessories.com’, are going have greater non-branded traffic, potentially representing close to 70% of total traffic.
In general, we can say that 30% of organic traffic should be branded and 70% non-branded.
Organic traffic e-commerce conversion rate
Let’s get down to where the money is, because we don’t care too much about rankings, pagerank or any other esoteric metric around SEO.
“What is the e-commerce conversion rate can I expect for organic traffic?”
Well, generic organic converts 2.9% in average, branded 7.1% although we have seen a maximum value over 20%, that’s really terrific!. Organic non-branded traffic converts 2.2% on average.
If your non-branded conversion is close to 0.1% you are having serious trouble here, it usually means you have done no SEO at all, or even worse: the SEO you are doing, or getting from a third party, is nothing more than a scam.
All data in a single chart
Here you have all the numbers in a single chart as a quick visual reference. Again, do not take this data too seriously, but it does give you something to compare to, and keep your mind busy thinking about the two more relevant objectives in SEO: how much traffic it brings in and its quality or conversion rate.
Once you review your numbers, decisions have to be made. We hope this gives some basic idea where to start adjusting your SEO strategy or just why you shoud having one.
Want to use this chart on your site? We would appreciate if you embed the following code:
‘>
Icons from: Iconspedia Weby Icon Set
VisualPharm Finance Icon Cet


