Over the past decade in this industry, much has changed, but most core concepts have remained. Optimizing the user experience is definitely one of those. Marketers still struggle in finding the tools, the technologies and the people to understand and improve the user experience

Site speed, as one example, is a critical factor for user experience, conversion rate, and SEO, but it is overlooked more often than acted upon.

This post is offered as a springboard for providing a better (i.e., faster) end-user experience not only on desktop but also on mobile, which continues to show steady growth as a device category segment for many websites.

Let’s begin with Google Analytics Site Speed reports themselves. It is usually most useful to use these reports to narrow your focus on specific pages or other dimensions.

Site Speed Overview report.
Defaulting to Comparison display, the Page Timing report highlights pages with load times longer than site average.
The Speed Suggestion report provides a PageSpeed score and link directly to the Google PageSpeed Tools discussed below.
Use the Load Time Metrics Comparatively

Don’t take the load time metrics as exact. They may be higher than what you see in other site monitoring tools due to being based on JavaScript executed client-side. Additionally the site speed reports are sampled reports.

Of course, the page that stands out as your slowest page probably really is your slowest page and a prime candidate for closer inspection!

After you evaluate the Site Speed reports in Google Analytics, where do you follow up? The tools outlined below allow to drill down further into site speed issues and understand the necessary corrective action.

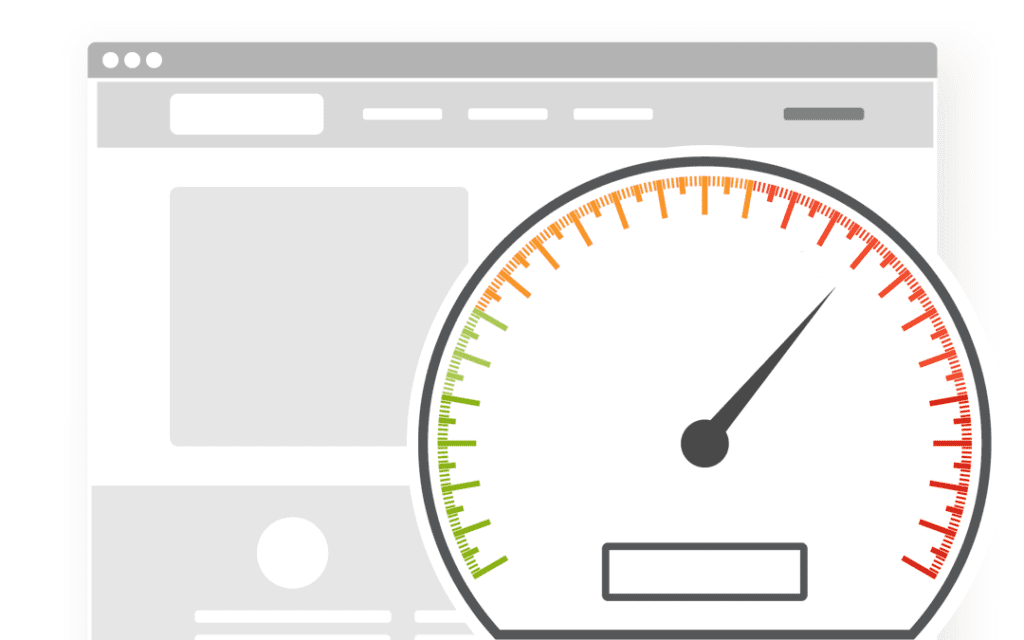
Google PageSpeed Insights

Google provides this tool to generate optimization insights. No specific expertise needed.

Overview section of the PageSpeed Insights report, available for both Desktop and Mobile.

The PageSpeed Insights report offers specific recommendations. For example, it may recommend that you consolidate and minify many script files. As a note, this kind of suggestion may be somewhat harder to implement if your CMS/website framework relies on separate script files as part of how it functions.

Specific PageSpeed optimization suggestions. Note the link at the bottom to download optimized images, JavaScript and CSS right from the report.

Think of the PageSpeed Insights recommendations as a good “best practice” checklist: implement the suggestions that you can, but understand that some maybe be less feasible, depending on your architecture.

Chrome Lighthouse

This is available as a dedicated Chrome Extension or from inside Chrome Developer Tools. Much like the PageSpeed Insights report above, it provides a report after it runs that gives recommendations and insights. It groups insights into four sections: Progressive Web App, Performance, Accessibility, Best Practices.

Chrome Lighthouse start screen.
Much like PageSpeed Insights, the Chrome Lighthouse extension provides specific optimization recommendations.

Chrome Developer Tools Network Traffic

The Network tab of the Chrome Developer Tools can also provide a breakdown of how fast page elements are loading and when. This requires more expertise to use and interpret.


Network tab in Chrome Developer tools breaks down load times and sequences for page elements.

The Performance Tab in Chrome Developer Tools can give a closer look a page loading and is more relevant than the Network Tab. Like the Network Tab, it takes some know-how to use and interpret.

The Performance tab provides even more relevant detail for isolating page speed issues.

If you encounter any difficulty in interpreting the Network and Performance tabs in Chrome Developer Tools, your front-end Web developer should be able to assist you, and would likely be interested to review the breakdown with you.

In any case, as you formulate your strategies for user-experience optimization, don’t forget the Google Analytics Site Speed reports and the additional Google and Chrome tools that you can take advantage of today.

Message Sent

Thank you for registering.

Cardinal Path hosted a live session to connect with you and answer all your questions on Google Analytics.
Get all the expertise and none of the consultancy fees in this not-to-be-missed, rapid-fire virtual event.

Thank you for submitting the form.

Thank you for submitting the form.

Message Sent

Thank you for registering.

Message Sent

Thank you for registering.

Message Sent

Thank you for registering.

Message Sent

Thank you for registering.

Message Sent

Thank you for registering.

Message Sent

Thank you for registering.

Message Sent

Thank you for registering.

Message Sent

Thank you for registering.

Message Sent

Thank you.

Click here to download access the tool.

Message Sent

Thank you for registering.

Message Sent

Thank you.

Message Sent

Thank you.

Message Sent

Thank you

Message Sent

Thank you

Message Sent

Thank you.

Message Sent

Thank you

Message Sent

Thank you.

Message Sent

Success!
Your message was received.

Thank you.

Thank you for registering.

Cardinal Path is continuing with its series of free training. Next we are conducting training on Google Data Studio. Check it out here.

Message Sent

Thank you for registering.

Thank you for your submission.

Your request has been submitted and a rep will reach out to you shortly.

Message Sent

Thank you for your interest.

Thank you for registering.

You should receive a confirmation email from GoToWebinar with your unique webinar login information. If you do not receive this email or have trouble logging in to the event, please email asmaa.mourad@cardinalpath.com.

Thank you for subscribing!

You're now looped into the world's largest GMP resource hub!

Thank you for your submission.

Thank you for your submission.

Thank you for your submission.

Thank you for your submission.

Message Sent

Thank you for registering.

Message Sent

Thank you for your submission.

Thank you for your submission.

Message Sent

Thank you for registering.

Thank you for registering.​

Paid media spend by Government websites increased a whopping 139% YoY in 2020.

2020 Online Behavior Live Dashboard

Message Sent

Thank you for registering.

Message Sent

Thank you for registering.

Message Sent

Thank you for registering.

2020 Online Behavior Live Dashboard

Thank you for your submission.

Message Sent

Thank you for registering.

Message Sent

Thank you for registering.

Message Sent

Thank you for registering.

Message Sent

Thank you for registering.

Message Sent

Success! Thank you
for reaching out.