More and more marketing people are embracing the power of web analytics. They are discovering how analyzing the behavior of the visitors to their websites (click stream data) can help them make actionable improvements to their campaign creatives, their website landing pages, and their website in general.
As marketers mature in their understanding of how to use and analyze this data, they often start asking questions regarding their data that are more complicated to answer.
Questions such as: Why are my visitors doing what they are doing?
The answers to questions like this one often lie in the intent that visitors have when they start their journey on your website. That is to say the reason why they came to your site. People who arrive at your website who intend to make a purchase online vs. those who want to locate a store, will likely create different click stream data (behaviors) and will also likely have different outcomes at the end of their visit. (for more information on advanced analytics thinking see Avinash Kaushik's blog Occam's Razor)
To help solve the issue of understanding why visitors are behaving the way that they are, VKI Studios has developed a simple survey application that will solicit visitor intent as people arrive on your site and then map that response to the click stream data they create during their visit.
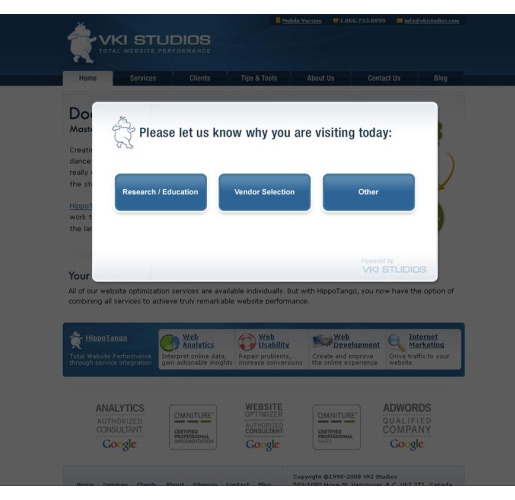
So you might be saying to yourself; “That's nice but so how is that going to help me?”
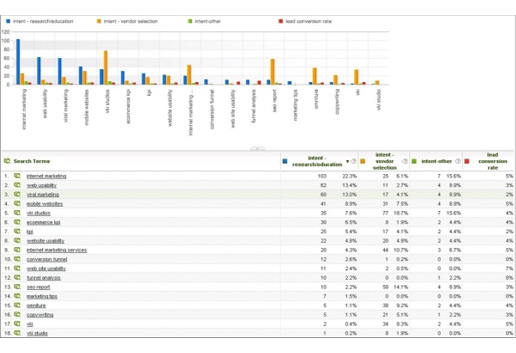
By adding intent information to our click stream data we can now analyze campaigns with the additional knowledge of what your visitors are wanting to do. It may be the case that certain campaigns (keywords, banner buys, emails…) are driving more visitors who are interested in doing research, and are less interested in purchasing. If this is the case and your goal is to sell them something, then you can choose to stop the campaign, or test different creatives and landing pages that will speak more appropriately to majority intent. The goal is to provide the visitor with the best possible user experience by tailoring your message and presentation to match what they're on your website to do. Even though your goal may be to make a sale, it is often the case that the path to purchase starts with research and progresses along from there. So which campaigns drive more researchers than purchasers and how do we give the campaigns dominated by researchers the information they need so that they will come back as a purchaser in a future visit? If we do a really good job we might even convert them from a researcher to a purchaser in the same visit.
Our application allows you to set what % of your visitors will be surveyed. It keeps at least 10% of visitors as a control group of un-surveyed visitors. This allows us to measure the cost of collecting this information by reviewing the conversion rates of those surveyed against those that weren't surveyed. Collecting data from your visitors always has a cost, and we want to help you measure it so that you can optimize your surveying.
Currently this application is configured for Omniture's SiteCatalyst. We are working on a version for Google Analytics which we hope to launch in the fall.
Our first ecommerce sites will launch with this application in October, and I hope to have a case study from these sites published in early November.
If you are interested in taking your analysis to the next level with this application or have any questions or comments please contact me.


