
Of the several dozen reports built into the Google Analytics navigation, some are more specialized and rarely used, while others – such as Landing Pages – remain one of the core reports accessed most regularly by the whole spectrum of Google Analytics users. Why is landing pages a perpetual favorite?
- first exposure: Landing Pages represent the first exposure that your users experience during a session and are likely more critical than some other pages viewed during the session.
- powerful secondary dimension combinations for performance analysis: while most Google Analytics reports benefit from secondary dimensions, the Landing Pages report perhaps benefits most from this feature. Which combination of Landing Page and Source Medium is producing the best lead submission conversion rate? Which combination of Landing Page and Device Category is suffering from the highest bounce rate? Add a secondary dimension to the Landing Pages report and find out immediately.
- session-level conversion and engagement metrics: as a nerdy but hopefully worthwhile observation, the Pages report does not offer session-level metrics such as Ecommerce Conversion Rate or Average Session Duration, but the Landing Page report does include these session-level metrics, since each landing page is associated with a session and therefore not limited to hit-level metrics.
For these reasons, and perhaps others, the Landing Pages report remains a go-to resource.
No Landing Pages Report in BigQuery?
Google Analytics has done a great job optimizing reports for web and mobile analytics. With Google exposing its internal technologies as a service, namely Dremel as BigQuery, everyone can build their own analytics platform, around this core component, and customize it as they wish.
Because Landing Pages is so central to Google Analytics, it may cause you some dismay when you link your GA property to BigQuery and start building the equivalent of a Landing Pages report, and find it not straightforward. You won’t even find the Landing Page dimension.
Google made it clear that Google Analytics data in BigQuery will not include all dimensions and metrics available in GA web interface and APIs.
Landing Page is a derived dimension and the best practice in big data world is to get data in “raw” format into the data lake first, then apply transformations. This provides better support for EDA, i.e. exploratory data analysis.
Never fear: we’ll be able to reproduce the Landing Pages report in BigQuery, with the following additional benefits:
- Sampling avoidance, regardless of session count and when secondary dimensions are applied
- hit-level analysis to solve a mystery from the Google Analytics UI
“Raw” or “Processed”?
Within E-Nor, we had discussions around the correct way to describe Google Analytics data in BigQuery: raw or processed.
The argument for using “raw” was based on the missing dimensions and metrics. In addition, that’s how data scientists call data as it enters the data lake.
Also tipping the scales towards “raw” is the fact that BigQuery data is completely unsampled. While applying a secondary dimension or a segment may cause sampling in the GA UI, no query in BigQuery will ever cause the skewing that sampling may cause in other environments.
The argument for using “processed” was based on hits being grouped into sessions in GA before exporting the data to BigQuery as well as Google Analytics view filters and settings being applied to hits in GA before the export, such as excluding internal traffic or consolidation of page variations.
Google doesn’t use the word “raw,” but many consultants and practitioners do.
With this discussion as background, let’s focus on producing the landing page report.
Landing Pages Report Replicated in BigQuery
The following query will retrieve a simplified Landing Pages report:
First, replace the term XXX_VIEWID_YYY with your actual view id, which is also the BigQuery dataset. Second, change the date range as you see fit, then run the query.
Listing: Replicating the Google Analytics Landing Pages Report in BigQuery
SELECT
  LandingPage,
  COUNT(sessionId) AS Sessions,
  100 * SUM(totals.bounces)/COUNT(sessionId) AS BounceRate,
  AVG(totals.pageviews) AS AvgPageviews,
  SUM(totals.timeOnSite)/COUNT(sessionId) AS AvgTimeOnSite,
from(
  SELECT
    CONCAT(fullVisitorId,STRING(visitId)) AS sessionID,
    totals.bounces,
    totals.pageviews,
    totals.timeOnSite,
    hits.page.pagePath AS landingPage
  FROM (
    SELECT
      fullVisitorId,
      visitId,
      MIN(hits.hitNumber) WITHIN RECORD AS firstHit,
      hits.hitNumber AS hitNumber,
      hits.type,
      hits.page.pagePath,
      totals.bounces,
      totals.pageviews,
      totals.timeOnSite,
    FROM (TABLE_DATE_RANGE ([XXX_VIEWID_YYY.ga_sessions_],TIMESTAMP('2016-08-01'), TIMESTAMP ('2016-08-31'))))
  WHERE
    hitNumber = firstHit
    AND hits.type = 'PAGE'
    AND hits.page.pagePath != '')
GROUP BY
  LandingPage
ORDER BY
  Sessions DESC,
  LandingPage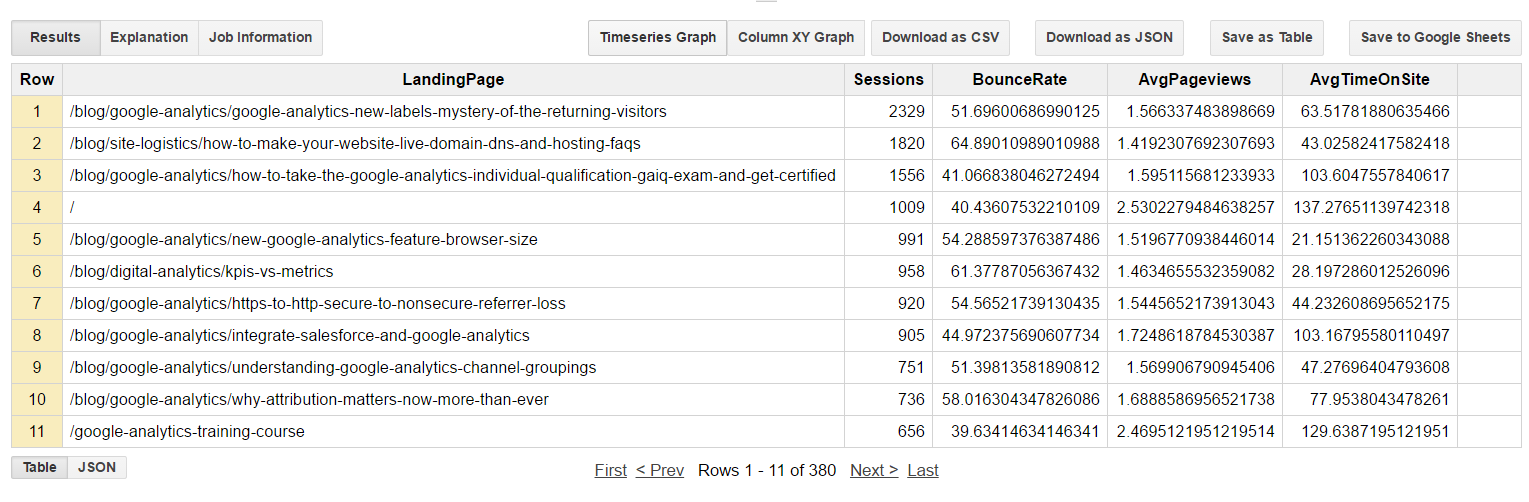
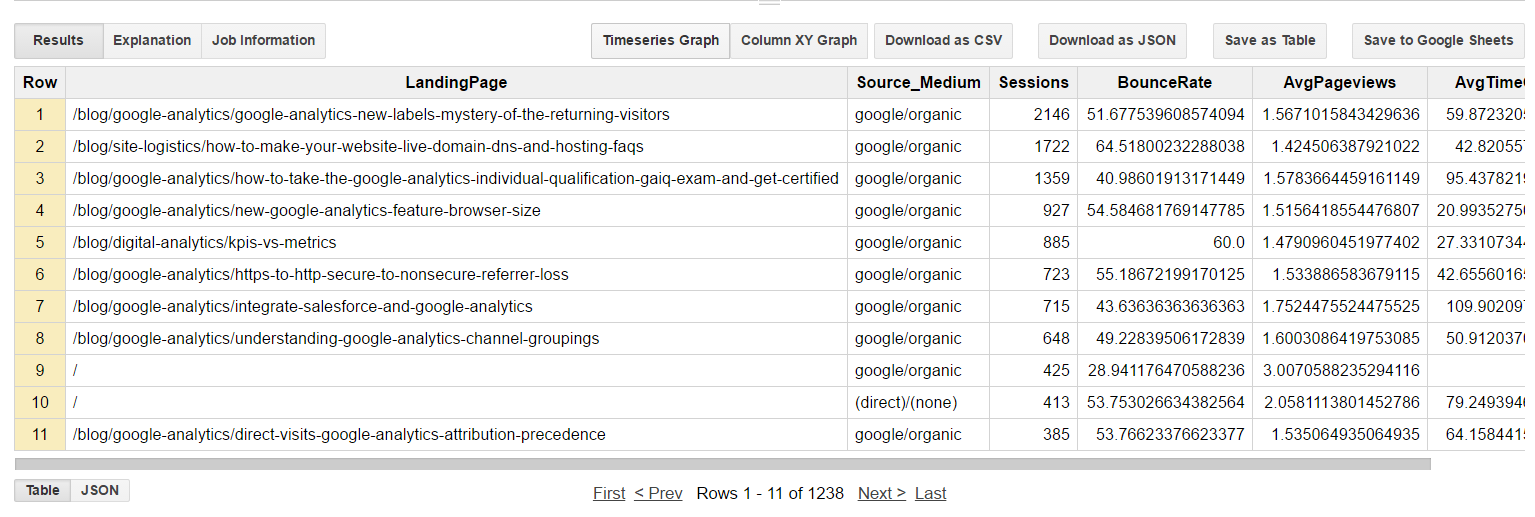
Secondary Dimension
We can change the query a little bit and add a secondary dimension, say, source and medium. In GA, we have a limit of 2 dimensions in standard reports and 5 in custom reports, though in BigQuery, we have virtually no limits.
Listing: Adding Traffic Source as a Secondary Dimension
SELECT
  LandingPage,
  Source_Medium,
  COUNT(sessionId) AS Sessions,
  100 * SUM(totals.bounces)/COUNT(sessionId) AS BounceRate,
  AVG(totals.pageviews) AS AvgPageviews,
  SUM(totals.timeOnSite)/COUNT(sessionId) AS AvgTimeOnSite,
from(
  SELECT
    CONCAT(fullVisitorId,STRING(visitId)) AS sessionID,
    Source_Medium,
    totals.bounces,
    totals.pageviews,
    totals.timeOnSite,
    hits.page.pagePath AS landingPage
  FROM (
    SELECT
      fullVisitorId,
      visitId,
      trafficSource.source +'/'+  trafficSource.medium as Source_Medium,
      MIN(hits.hitNumber) WITHIN RECORD AS firstHit,
      hits.hitNumber AS hitNumber,
      hits.type,
      hits.page.pagePath,
      totals.bounces,
      totals.pageviews,
      totals.timeOnSite,
    FROM (TABLE_DATE_RANGE ([XXX_VIEWID_YYY.ga_sessions_],TIMESTAMP('2016-08-01'), TIMESTAMP ('2016-08-31'))))
  WHERE
    hitNumber = firstHit
    AND hits.type = 'PAGE'
    AND hits.page.pagePath != '')
GROUP BY
  LandingPage,
  Source_Medium
ORDER BY
  Sessions DESC,
  LandingPage
danger of sampling
Hit-level Granularity
Finally, here is something that you can only do in BigQuery and not in GA. In BigQuery you have better granularity than GA and you can examine individual hits.
What if you get a lot of landing pages with value = ‘(not set)’?
BigQuery is better suited to examine the cause of this unexpected behavior. Here is the query to catch the hits that may be sent before the first pageview hits.
Listing: Using Hit-Level Granularity in BigQuery to Determine Sessions that Begin with an Event Hit
SELECT
  *
FROM (
  SELECT
    fullVisitorId,
    visitId,
    MIN(hits.hitNumber) WITHIN RECORD AS firstHit,
    hits.hitNumber AS hitNumber,
    hits.type,
    hits.isInteraction,
    hits.eventInfo.eventCategory,
    hits.eventInfo.eventAction,
    hits.eventInfo.eventLabel,
    hits.eventInfo.eventValue,
    hits.page.pagePath,
  FROM (TABLE_DATE_RANGE ([XXX_VIEWID_YYY.ga_sessions_],TIMESTAMP('2016-05-01'), TIMESTAMP ('2016-05-31'))))
WHERE
  hitNumber = firstHit
  AND hits.type != 'PAGE'
  AND hits.isInteraction = TRUE
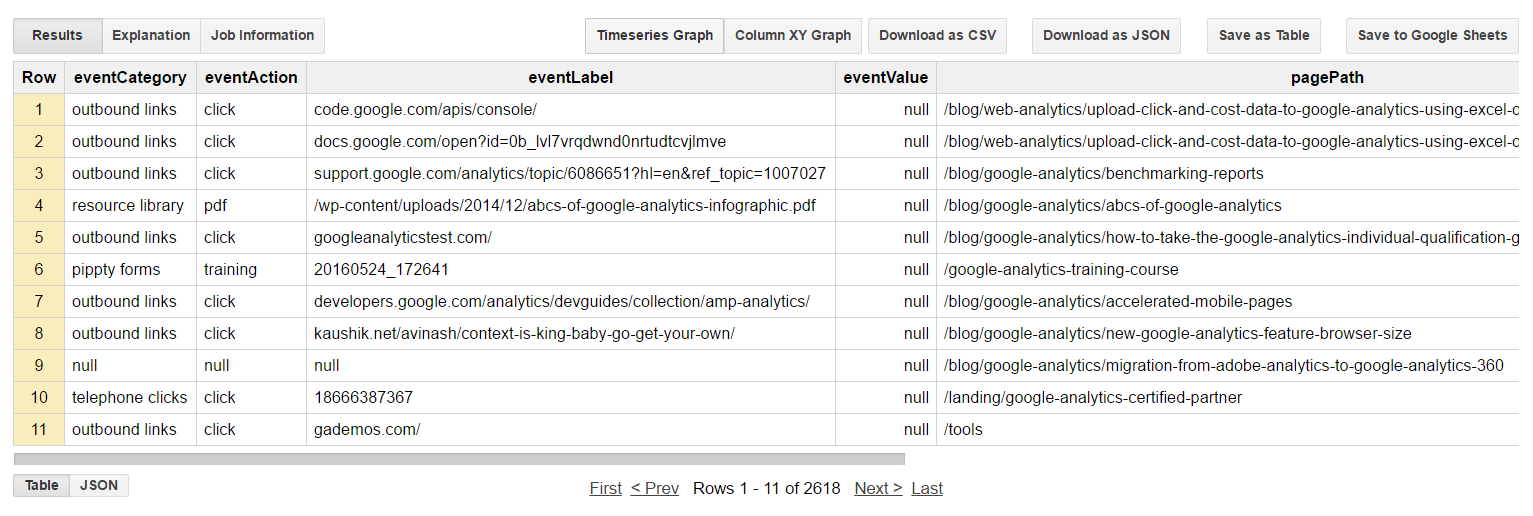
This hit-level analysis in BigQuery solves the (not set) issue that can in some instances appear in the Google Analytics UI or API.
As you will notice from the query, we are looking for the first hit in a session that is not a PAGEVIEW. We also needed to make sure it is not a non-interactive hit, since non-interactive EVENT hits don’t corrupt the landing page dimension.
In an investigation for a client here at E-Nor, we found out that many first hits were video EVENTS. We deduced the user was watching a video and no interaction was happening on the site until the GA session timed out. With the next hit, which was a video EVENT, a new session was started and, naturally, without a landing page.
In another case, we found a custom script that was firing EVENT hits before the pageview, causing the session to lose their landing pages.
Conclusion
 At first, after linking Google Analytics with BigQuery, some were not happy without the direct access to some of the dimensions and metrics conveniently available in the Google Analytics UI.
But in exchange, we got a lot of flexibility, power, and access to very granular data we didn’t have in Google Analytics.
Each platform has its particular strengths, we can take advantage of both. As with many things in life, it all starts with choosing the right tool for the job.


