 Canada, oh Canada. We’ve extracted a handful of gems from you…Maple Syrup…Hockey…The Toronto Raptors and Vancouver Grizzlies…even Justin Bieber. Apparently, you’re also #1 in the world in fruit juice drinking (real statistic), which is an amazing talent.
If you’re a frequent reader, you might be used to us posting advanced analytics topics, such as Google Analytics Premium, Integration with Tableau, Qualitative and Quantitative integration, Cohort analysis, etc. For analytics ninjas, this post might be a bit lite. However, when you’re stuck in the complex, you overlook and forget about the basics, which have their own value – so a refresher is always good.
The Challenge: Pageviews from Canada but No Leads?
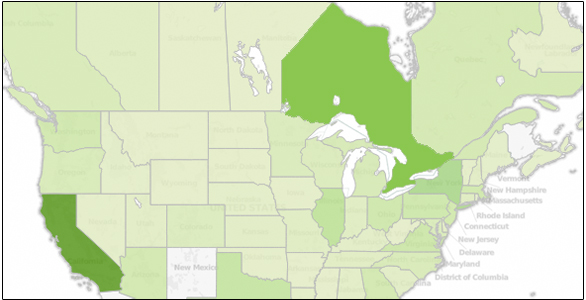
While assessing one of our client’s content marketing strategies, we found they had an exceptional amount of pageviews from Ontario, Canada. They were concerned though. For some reason though, they haven’t gotten one sales lead from that region. Are they missing out on top Canadian dollars?!
We were hoping that their analytics data could give us some insights as to what was happening and why they weren’t getting leads from there. In this post, we’d like to demonstrate how we used Google Analytics in a simple/basic way to extract some insights into such questions.
A Closer Look For Patterns
When we looked at their data, we created an advanced filter that only showed visits from the region Ontario and we saw this:
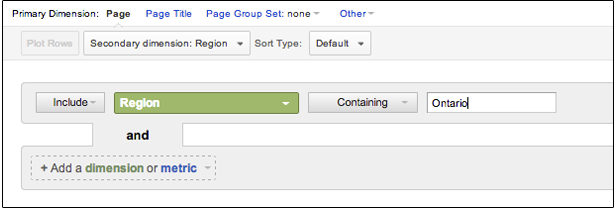
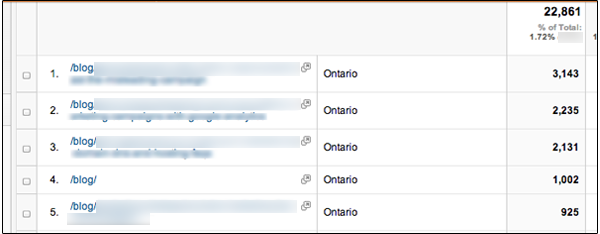
Anything jump out at you? It seems that most of the urls in the top content from Ontario have “/blog” in it (the client has 2 sites connected to this domain – a main site and a blog).
Interesting. We were wondering if that pattern had any connection.
Validating the Theory
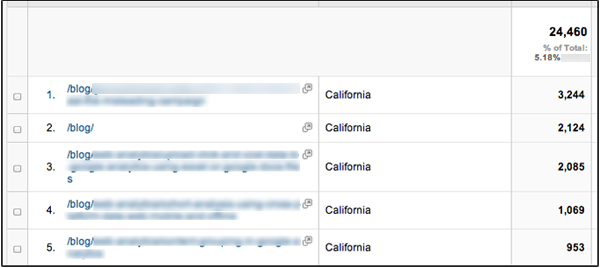
So we compared this to a region where they were getting a healthy amount of traffic and successfully generating leads – California. When we filtered traffic for California, at first glance, the pageviews looked fine. Thinking about the pattern from Ontario (“/blog”), we then filtered even further for only California blog traffic. There really didn’t seem to be anything unusual.
So what was the issue then??? Well, keep in mind, we’re not only concerned with pageviews, we’re concerned about leads. In other words, conversions define as leads, which in this case, the client defined it as contact-form submissions. Both reports show a healthy amount of pageviews, however, one region is generating leads, one is not.
Looking at the conversion report for California, overall, it maintained a healthy look. But after again filtering for only blog conversions, then comparing it against Ontario, that’s when we uncovered the gem! Consistency in the theory!
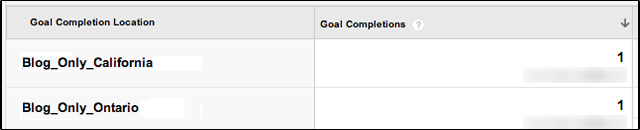
Conclusion
Voila! When both regions are filtered for blog traffic, the percentage of conversion balances out (in this case, the visits were almost equal so the conversion being 1 is an equal percentage of conversion)! We can’t say definitely, but after drilling down the data, signs lead to the blog not necessarily generating leads the way the client wanted (and since most Ontario visits were blog visits, they don’t so much get Ontario leads).
That’s one way to get insights using some critical thinking and the tools in Google Analytics. Of course, there are infinite ways to torture the data and therefore infinite insights.
Real Analytics ninjas may also be thinking that form conversion shouldn’t be looked at in a vacuum – for the blog, there should always be micro conversion goals, such as email newsletter subscriptions, sharing, comments, does it refer to the main site, and generate interest or micro conversions there, etc.
The next next step is our analysis is understand the behavior of users across multiple sessions and answering questions like: are visitors who read the blog come back and convert in later sessions.
We promised to keep this blog post lite, so we will answer this question in a future post! 🙂 Now it’s your turn, how do you use Google Analytics to derive actionable insights.


