When Google Analytics makes changes to their platform, it’s usually a good thing, and helps users navigate through the dashboard easier, offers a more powerful data experience and overall is seen as beneficial to the user.
Google Analytics did just that this time around, as they rolled out some improved features earlier this month. We at E-Nor dove right into the changes and have been loving them.
There was a blog post on the Google Analytics blog as well as a great one by onlinemarketinginstitute.com, but a lot of our clients are still unaware of the spiffy new changes, so we wanted to pass the information along!
Check it out:
Improved Navigation
The first change you notice when logged into Google Analytics is there are less tabs at the top of the screen. Just the simple Reporting, Customization, Admin and Help tabs are now available here. This area had been freshened up a bit, and some of the reports here have been moved to the left sidebar. We’ve noticed this definitely makes more sense, and offers up a more unified placement for the tools. Plus, the top orange navigation bar floats as the user scrolls down the page. Pretty cool! 😉
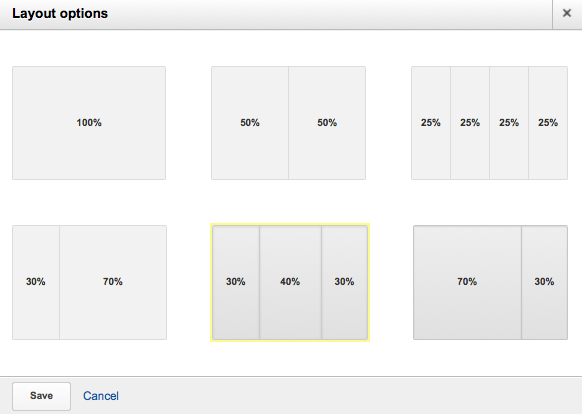
Create Your Own Custom Dashboard
We all have our own preferences, right? So too is the case when working with Google Analytics, and the gurus at Google have figured that out! The platform now offers new enhanced personalized dashboards. Users can choose from a variety of layouts, giving them a handful of options available. This feature expands the way the dashboard is laid out, and how users can see their data.
Dashboard Additions
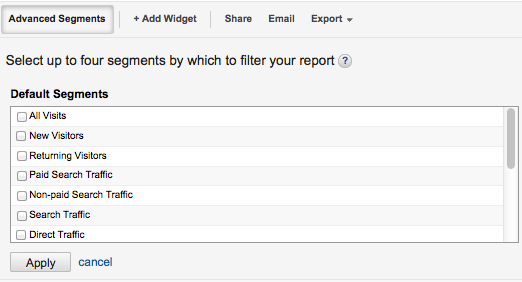
1. Advanced Segments
Anyone who works regularly in Google Analytic is aware of the Advanced Segments feature. Well, thanks to this most recent round of changes, this tool has been added to the dashboard. (Yay!) Users can find this button in the upper left section of the dashboard near the Audience Overview header.
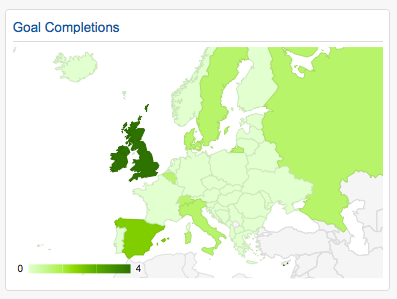
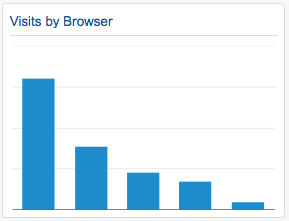
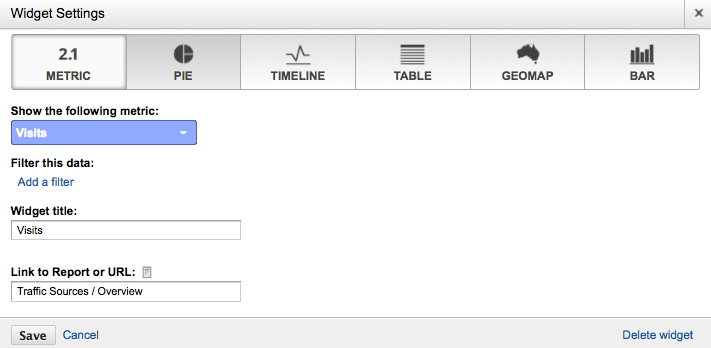
2. New Widgets
The Geo Maps and Bars widgets are both new additions to the Google Analytics dashboards. You will also find the Geo Maps have been added for custom reports. These are available on the improved dashboard, and provide yet another set of data gathering tools that help users. The Geo Maps widget allows users to color code data by country, state and so on. The Bars widget give more advanced graphic data abilities.
Examples of Widgets
So if you haven’t already noticed the improvements to the Google Analytics interface, now is a good time to jump in and check them out.
We at E-Nor have found these new and/or revised features and tools highly beneficial, and love the fact that they allow us to continue to provide top-notch analytic services to our clients. We hope you enjoy the changes too!


