You (or your client) may be a large brand with tens, hundreds or thousands of websites/apps under one main umbrella. Measuring each digital asset is great, but it may only show you part of the whole picture.
In order for you to truly benefit from your analysis and get real insights out of your data, the way you structure your Google Analytics account and group business digital assets appropriately is key.
There are an infinite number of ways to structure your Google Analytics Accounts/Properties/Views. But you should organize your accounts in a way that allows clean and clear data reporting and analysis, considering factors like how you want to report on the data and what data needs to be aggregated together.
In this post, I’d like to review 5 considerations that may influence the way you structure your sites/apps in Google Analytics to allow for maximum insights.
1) Group a Visitor’s Journey Across Sites Under One Property
Several days ago, I landed on disney.com to look for information on the new “Star Wars: The Force Awakens” movie. While browsing, I came across an ad for some of the Star Wars toys (thought I might buy some for my kids!), so I clicked on the item and was taken to disneystore.com to complete the checkout.
It made me wonder, how should Disney track this path?
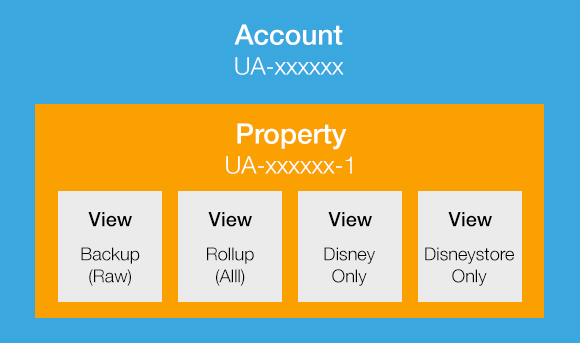
If you have a common navigation path across sites, one trick is having a Google Analyics account with one property strictly dedicated to this path, which will allow you to see the whole user session, campaign and conversion information. This is known as “rollup reporting”. You can use views in conjunction with filters to see subsets of data as desired.
Example:
- Domains: disney.com and disneystore.com
- Properties: UA-XXXXXX-1
- Views:
- Backup (raw)
- Rollup (all)
- disney.com only
- disneystore.com only
NOTES:
- To implement this structure, you need to implement cross-domain tracking in order to carry over user session information when navigation across sites take place.
- Also remember to concatenate hostname to request URI in the rollup view using advanced filter, to be able to distinguish identical URLs in both sites.
This doesn’t mean you don’t track each website separately, but in a case like this, that wont allow you to attribute purchases to appropriate cross-site campaigns or visits. To see a complete picture while only tracking each asset separately will only cause your channel data and session data to essentially be incomplete, and thus, most reports in Google Analytics won’t really be usable.
2) Group Related Business Verticals
A great practice is to create different Google Analytics account for each different business vertical.
If you are running a multi-vertical company like Universal Entertainment, which has hundred if not thousands of sites under each vertical (e.g. movies, music, theme parks, etc.), it’d be extremely beneficial to have an overall view of each verticals’ performance, where you can get quick on demand insights.
For example, justinbiebermusic.com and theweeknd.com are both music sites under Universal.
minionsmovie.com and harrypotter.com are movies under Universal.
Most likely, each department has it’s own seperate marketing goals and initiatives. It’d be extremely helpful to have an aggregate view to see each respective departments’ performance.
In this case, you can use multiple trackers in order to aggregate different types of data on each site. For example, you can report each hit to 2 properties – vertical specific (ex. music) + aggregate property (all verticals). (Note: with Google Analytics Premium, you have the ability natively to aggregate data from different properties in one rollup property).
To implement this structure you need to:
- Create one GA account
- Group each business vertical and track its sites under one GA property.
- To view each vertical’s site individually, you can use “Views” with filters.
- Use multiple trackers to report all verticals data to one property that aggregate all verticals’ data (or use the rollup property for Premium to aggregate data from all verticals’ properties together).
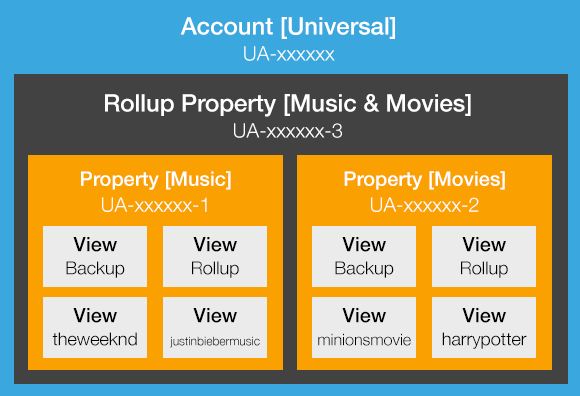
Example:
- Music Domains: theweeknd.com and justinbiebermusic.com
- Property: UA-xxxxxx-1
- Views:
- Rollup (all)
- theweeknd.com only
- justinbiebermusic.com only
- Movie Domains: minionsmovie.com.com and harrypotter.com
- Property: UA-xxxxxx-2
- Views:
- Rollup (all)
- minionsmovie.com only
- harrypotter.com only
- Rollup Property: UA-xxxxxx-3 that aggregates (UA-xxxxxx-1, UA-xxxxxx-2) together
3) Structure Properties by Platform Type
With the expansion of the digital ecosystem, there are many platforms your property structure needs to account for, like:
- Mobile apps
- IOS
- Android
- Website(s)
- Kiosks or other electronic devices sending hits via Measurement Protocol
If you are in a situation where you have multi-platform tracking, my recommended solution is to track each platform independently. Otherwise, the different data sets may make analyzing and making sense out of the data very challenging. User behaviors between a mobile app and a website are different and aggregating them together in a report could make it harder to report on data. Even for simple reports, there may be no tangible value to your analysis and many metrics may not make sense (e.g. pages per session, bounce rate, etc.).
In most cases, the thing you’ll need to report on across different platforms are very high level usage report like total sessions for mobile and web. And usually, when this is done, the very next thing you’ll want to do is break it down by platform!
But then the important question at that point would be, “Separate platforms into Properties or different Accounts?” I recommend separating platforms at the Properties level.
- Although different Accounts will give you additional flexibility to have lots of Properties and Views per Account, you’ll need to replicate the same configuration for each additional Account manually. That can be a lot of work and increases the ongoing maintenance effort.
- Sampling rates are applied at the Property level for GA standard. This means separation at the Property level (rather than the View level) will help you avoid hitting the sampling rates or the monthly data limit if you have huge traffic volumes per platform. And separate at the Account level doesn’t provide any additional benefit in this case.
- Reporting on different platforms will be simpler, removing the possibility of data leaks in different platforms reports that could happen when using segments or filters at the View level.
4) Divide Properties That Generate Large Volume of Traffic
We’re going backwards here! If your organization site(s) is generating a large traffic volume and hitting sampling rates or the maximum data limits, you might need to revisit organization’s account structure.
Sampling occurs automatically when more than 500,000 sessions are collected for a standard GA report (50 Million for Premium accounts).
Data limits for Google Analytics standard is 10 million hits per account per month (in the billions for Google Analytics Premium).
Sampling rates are applied at the property level if you are a standard GA user (at the view level for premium users).
By separating your traffic, you allow Google Analytics to generate reports more quickly for those large data sets. You may decide to drive some sites traffic to different properties/views to reduce the sampled percentage of your data.
Note: just make sure never to separate interconnected site (like store and its payment sites).
5) Group By Region
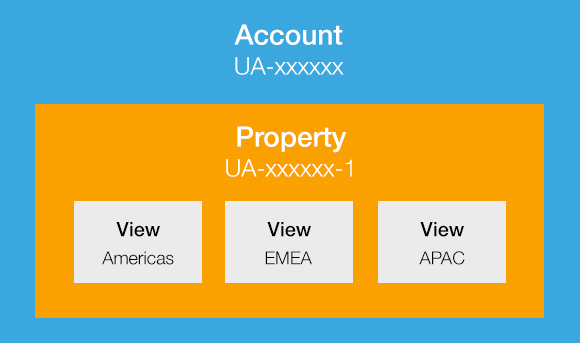
Generally speaking, larger companies with multi region site would have very similar sites pages, products and objectives. In such cases, the proper account structure would be achieved by having one property and multiple views serving each country/region.
However, because structuring a multi-region site might not be ideal in all cases, actually that can be harder than it sounds.
Depending on the factors discussed earlier, it might be again beneficial to group GA accounts into regions while considering the following:
- How similar are these regions’ sites in terms of functionality, navigation paths, products or services, conversion actions and expected visitors behavior?
- Who reads, analyzes, and makes decisions based on each regions data report?
For example, if you are running specific portals for the Americas, EMEA, and APAC regions, the following might be true:
- Products would be localized to server a specific market and can’t be sold outside it.
- The Marketing and technical teams are totally independent.
- In terms of aggregate data, upper management really only cares about revenue data, which could be served easily outside GA.
Thus, you may want to simply have separate accounts for each respective region.
However, if you have sub-regions that are similar in products, have one main marketing team, etc. another option is to divide GA accounts/properties by sub-regions.
Conclusion
I hope we’ve given you some great ideas on how to structure your accounts in case you have the complication of an abundance of sites, apps, and platforms. However, in the end, it’s up to you to come up with the structure that fits the best for your business needs and objectives.


