How do you measure social? There’s a lot of speculation about how much value an additional Facebook fan actually brings into your business. If you’re not tracking your online performance, you’re not able to answer this question. If you are not yet tracking your website performance, then you should start now with a web analytics tool such as Google Analytics.
An important KPI for an e-commerce site owner is knowing; “What is my ROI from my social media efforts?” But we might also want to know, “Does a Facebook ‘Like’ action drive any immediate sales?” This is what we’re here for.
To illustrate how this would work, let’s use the new X-Men movie as an example. Say you’re all excited about the movie (big fan) and you absolutely want that Magneto collector’s item, and you find it on an e-commerce site as a result of your friend “liking” it.
The Process:
- My friend ‘likes’ this collectible Magneto action figure on an e-commerce site selling this figure.
- That “Like”, and the specific URL gets published in his Facebook feed where I see it.
- I click on the link, and get redirected to that Magneto action figure product page on the e-commerce site (the same unique URL).
- I say, “Cool! I’m going to buy one!”.
- I make an impulse buying decision to buy this $100 collectible action figure.
- The whole process is recorded by Google Analytics and the transaction is processed.
The idea here is that there is an interaction between one visitor liking a URL, and another visitor clicking through on this link. When we see large numbers of visitors from Facebook landing on the URLs with large numbers of “Likes” associated with these same URLs, we can assume there is a “virtuous cycle” of likes directly leading to more referrals, leading to more purchases (hopefully!).
So “Where do I find this information in Google Analytics? “, you may be asking…
First, read Cardinal Path’s post on how to track Facebook Likes in Google Analytics.
There is a multi-step process to the finish line, so please follow along closely. We will need the following reports:
- The pages that were ‘liked’
- The landing pages where the referrer was Facebook
- Custom report
*Note: Because we are working with multiple reports, make sure that your time frame is consistent.
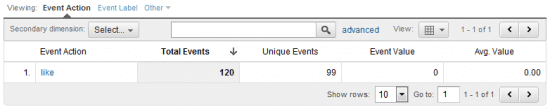
First Report: Start with the pages that were ‘liked’. Go into Contents > Event Tracking > Find your ‘like’ action and go into that report. Export this out of Google Analytics as an Excel file.
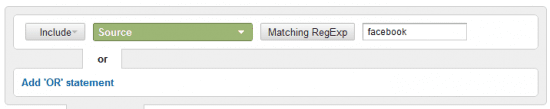
Second Report: Next, run an advanced segment to filter only traffic coming in to your site from Facebook. Then go into your Content > Landing Pages report to get the landing page URLs. Export this report out of Google Analytics as an Excel file.
Third Report: Finally, you’d want to create a custom report that will detail those visits from Facebook with the metrics that really matter to you; i.e. transactions/order confirmations. This is how my report looks like: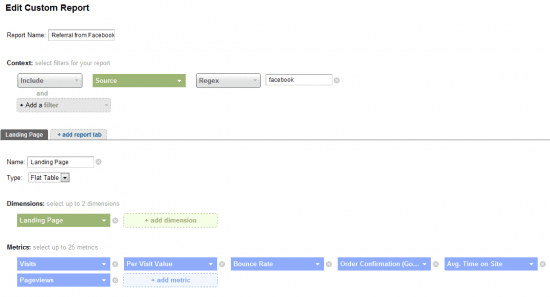
Export this report once it’s done. Now, it’s time to match up your data points!


