breaking bad walter white jesse pinkman in desert

“Say My Name…”
“…Heiseinberg…”
“You’re god!@#$ right…”

Last night marked an awesome ending to an awesome show. Unlike some other anti-climactic series finales (that shall remain nameless…Dexter) copping out and leaving it ambiguous to the fans imagination, Vince Gilligan (creator of Breaking Bad) gave us what we wanted. Walter White wrapped up all the loose ends and in such poetic Heisenberg fashion. No spoilers here, but if you’re a fan and you haven’t seen the finale, close this browser right now and go see it!

For Walter White, the purity and value of his “percentage” is the basis and strength of Heisenberg. 99% pure. The perfect cook. That’s how he got so far and that’s how he got so “lucky” as to never end up with a bullet in his back! Everyone wanted the value that percentage could provide!

What value are your exit-rate percentages providing you? One Google Analytics report might say your exit rate is 30%, another one from the same exact data may say 99%. Which one do you use? How do you use it?

Like Heisenberg, we’ll show you how to really “cook” the numbers and get the purity you’re looking for…glass grade…

Exit Rates – How important is the purity of your percentages?

One of the most common difficulties with using Google Analytics is making sure you understand what a particular dimension or metric really means.

Many users of Google Analytics are unaware that there are two very different ways exit rate is calculated. It’s important to know the difference between these two calculations and to use the right one when performing any analysis.

Let’s start by taking a look at an example from GA. Below are the same page, shown in two different reports:

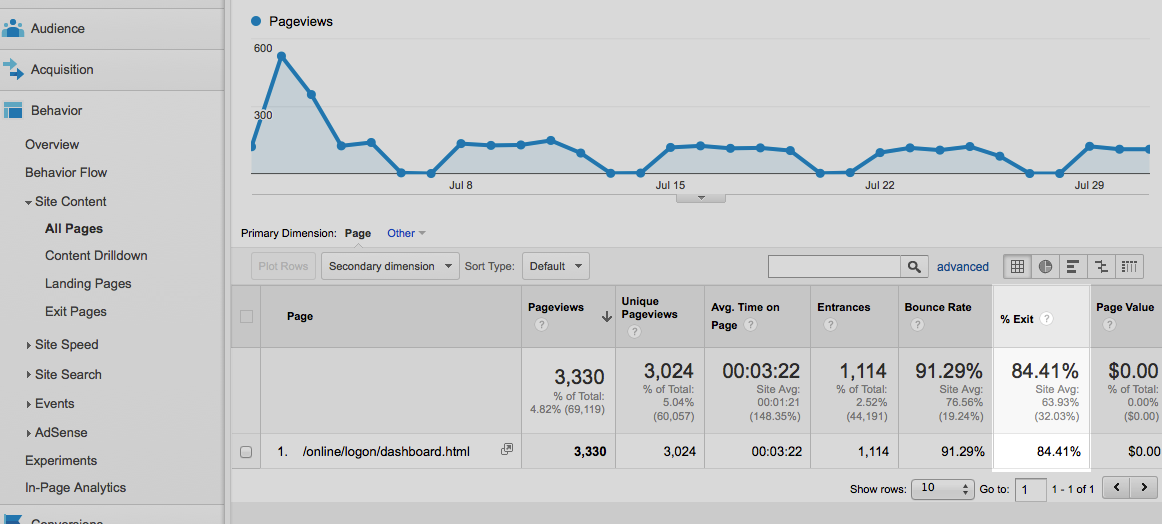
Site Content –> All Pages report
exit-rate-all-pages-report-screenshot

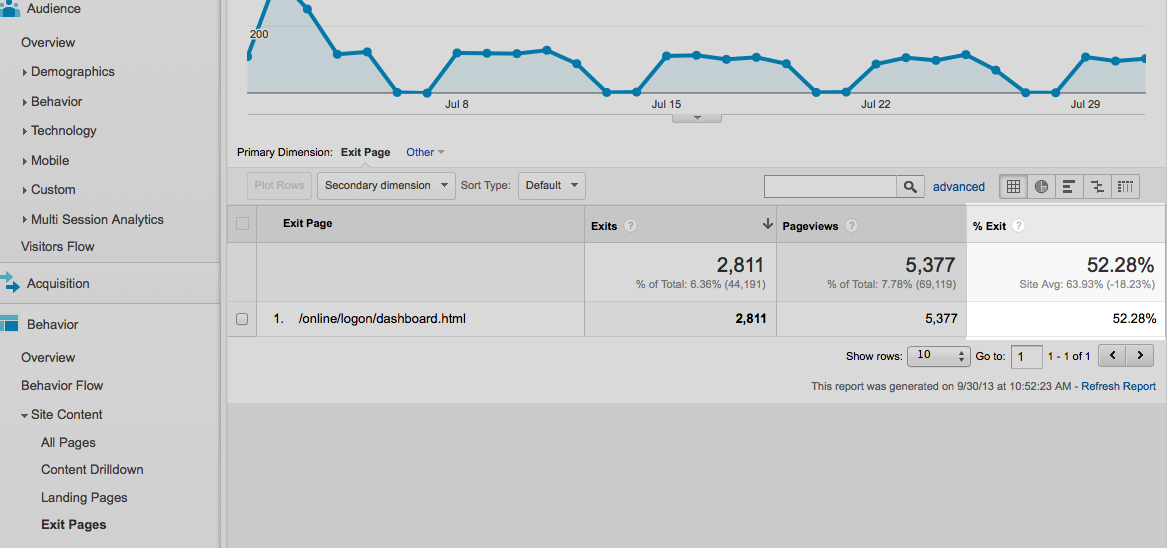
Site Content -> Exit Pages report
exit-rate-site-content-screenshot-1

Although both reports start with the formula

(Exit Rate) = (Exits) / (Pageviews)

each report uses its own pageview number.

Take another look at the screenshots above. Notice that for the same page, the Pageviews metric has different values.

All Pages Report

Pageviews in this report are the total number of times that the page-of-interest was viewed by any visitor.

(Exit Rate) =

(# of visits in which the page-of-interest was the exit page)
____________________________________________________________
(# of pageviews of page-of-interest during any visit)

For pages that have the same number of exits, the exit rate will be lower for pages that have multiple views per visit, such as navigational hub pages.

Exit Pages Report

Pageviews in this report are the total number of times ANY page was viewed in visits in which the page-of-interest was an exit page.

(Exit Rate) =
(# of visits in which the page-of-interest was the exit page)
____________________________________________________________
(# of pageviews of all pages viewed where page-of-interest was an exit page)

For pages that have the same number of exits, the exit rate will be higher for pages that are exit pages during visits with fewer pages/visit. For example, a visit in which someone goes directly to a contact information page and then leaves.

Lets try and test your knowledge of exit rates. Use the 3 visits below and calculate exit rates for pages A-D for both reports.

Visit 1:
B, A

Visit 2:
A, A, A, A, D (The user refreshed the page 10 times?)

Visit 3:
A, B, D, C

Answers:

Page

‘All Pages’ Exit Rate

‘Exit Pages’ Exit Rate

A
1 ‘A’ Exits / 6 ‘A’ Pageviews = 17%
1 ‘A’ Exits / 2 ‘2’ Pageviews =50%

B
0 ‘B’ Exits / 2 ‘B’ Pageviews = 0%

C
1 ‘C’ Exits / 1 ‘C’ Pageviews = 100%
1 ‘C’ Exits / 4 ‘C’ Pageviews = 25%

D
1 ‘D’ Exits / 2 ‘D’ Pageviews = 50%
1 ‘D’ Exits / 5 ‘D’ Pageviews = 20%

Total
3 Exits / 11 Pageviews = 27%

Just as Walter White did in the finale, it will be very important to to pick the proper exit or exits during analysis! Now that you know the difference, you can now examine the exit rates in both reports for a particular page and combine that with other data elements to confidently gain insights.

Message Sent

Thank you for registering.

Cardinal Path hosted a live session to connect with you and answer all your questions on Google Analytics.
Get all the expertise and none of the consultancy fees in this not-to-be-missed, rapid-fire virtual event.

Thank you for submitting the form.

Thank you for submitting the form.

Message Sent

Thank you for registering.

Message Sent

Thank you for registering.

Message Sent

Thank you for registering.

Message Sent

Thank you for registering.

Message Sent

Thank you for registering.

Message Sent

Thank you for registering.

Message Sent

Thank you for registering.

Message Sent

Thank you for registering.

Message Sent

Thank you.

Click here to download access the tool.

Message Sent

Thank you for registering.

Message Sent

Thank you.

Message Sent

Thank you.

Message Sent

Thank you

Message Sent

Thank you

Message Sent

Thank you.

Message Sent

Thank you

Message Sent

Thank you.

Message Sent

Success!
Your message was received.

Thank you.

Thank you for registering.

Cardinal Path is continuing with its series of free training. Next we are conducting training on Google Data Studio. Check it out here.

Message Sent

Thank you for registering.

Thank you for your submission.

Your request has been submitted and a rep will reach out to you shortly.

Message Sent

Thank you for your interest.

Thank you for registering.

You should receive a confirmation email from GoToWebinar with your unique webinar login information. If you do not receive this email or have trouble logging in to the event, please email asmaa.mourad@cardinalpath.com.

Thank you for subscribing!

You're now looped into the world's largest GMP resource hub!

Thank you for your submission.

Thank you for your submission.

Thank you for your submission.

Thank you for your submission.

Message Sent

Thank you for registering.

Message Sent

Thank you for your submission.

Thank you for your submission.

Message Sent

Thank you for registering.

Thank you for registering.​

Paid media spend by Government websites increased a whopping 139% YoY in 2020.

2020 Online Behavior Live Dashboard

Message Sent

Thank you for registering.

Message Sent

Thank you for registering.

Message Sent

Thank you for registering.

2020 Online Behavior Live Dashboard

Thank you for your submission.

Message Sent

Thank you for registering.

Message Sent

Thank you for registering.

Message Sent

Thank you for registering.

Message Sent

Thank you for registering.

Message Sent

Success! Thank you
for reaching out.