The benchmarking reports allow organizations to compare their performance across a number of metrics to their peers. Peers can be defined by some combination of:
- Industry category — 1,600 categories helpfully broken down from top level to two levels below that
- Geographic market — 1,250 countries and regions or states if you happen to be interested in the U.S.
- Sessions per day — 7 buckets
Google Analytics helpfully defaults to representative peer groups for Industry Category and Sessions per Day, but you can change these — and Geographic market — to whatever you want! Google’s selections are fairly accurate.
The metrics available in Benchmarking reports are:
- Acquisition: Sessions, % New Sessions and New Users
- Behavior: Pages / Sessions, Avg. Session Duration and Bounce Rate
Google Analytics offers three benchmarking reports:
- Channels (default channel grouping)
- Location
- Device Category (desktop, mobile, tablet)
Your Peer Group
Each benchmarking report tells you the size of the peer group you’ve chosen:

Who are these 155 web properties? The peer group is comprised of other organizations who have Google Analytics on their sites, have opted in to benchmarking (as you have — see Google Respects Your Privacy below) and meet the criteria you’ve set (see image above). In this case, the criteria are sessions from Texas from large Shopping sites.
Google Analytics will choose an Industry Vertical for you. Most industry verticals have many, many subcategories. Be sure to take a look at these and choose your own. “Shopping” includes “Women’s Clothing”, “Auction”, “Uniforms & Workwear”, etc.
Use Cases for the Benchmarking Report
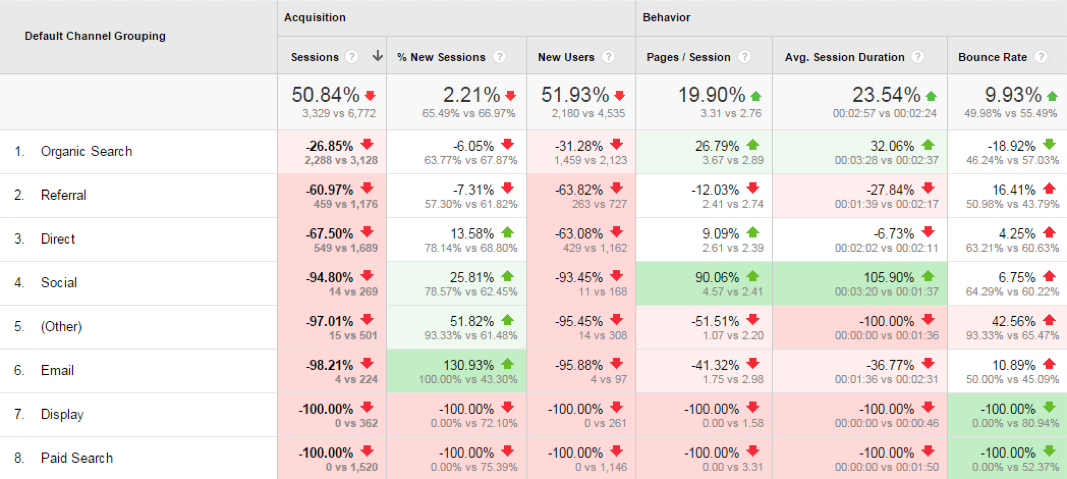
For the example below, in this particular country, France, key insights include:
- We seem to have no active marketing campaigns — Paid Search, Display, Social and Email — relative to our peers. For example, for Paid Search, our GA data has 0 sessions while our peer group averages 1,520 sessions.
- For our peers, Paid Search and Email have lower bounce rates (52% and 45%) while Social and Display (60% and 81%) generate higher bounce rates compared to other channels. As we evolve our marketing campaigns, maybe we should focus on the two channels that seem more successful for our peers — Paid Search and Email.
If we do have Social, Display, Email and Paid Search campaigns, maybe we are not using Google Analytics campaign parameters to track them. Campaign parameters tell Google Analytics how to report on our marketing projects.
A Deeper Dive
By exporting data (by choosing Export from the Benchmarking – Channels report and exported to Excel (XLSX) format) and comparing only those channels in which we actually participate, we see that Organic Search makes up a larger percentage of total sessions for us than it does for our peers. While this is interesting, we simply don’t know enough about our peers to develop any actionable insights.
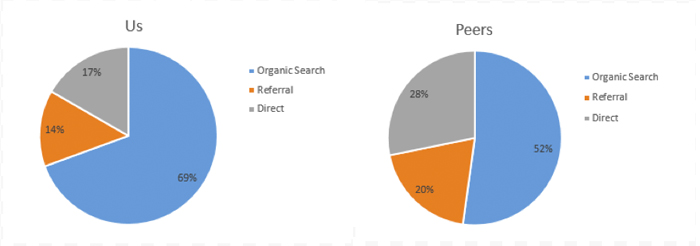
Looking at year-over-year growth, for organic search, our sessions increased 25% compared to 1% for our peers. This seems more actionable.
- A new SEO initiative may be responsible for this growth or maybe we have a new, more SEO-friendly site
- Our referral traffic — while down — is not down by as much as our peers.
| Organic Search | Referral | Direct |
|---|
| US | Peers | US | Peers | US | Peers | |
|---|---|---|---|---|---|---|
| 2015 | 131,571 | 110,064 | 25,598 | 28,856 | 44,596 | 58,978 |
| 2014 | 105,214 | 108,739 | 26,461 | 35,211 | 45,922 | 62,144 |
| % Change | 25% | 1% | -3% | -18% | -3% | -5% |
*Note: data by country is not available prior to May 8, 2014
Benchmarking vs Benchmarking
Benchmarking can be used to determine performance for key performance indicators (KPIs) or goals, as in targeting:

Brazil nuts in their pod https://www.stdf-safenutproject.com/
- Organic search growth equal to total organic growth for the U.S. in 2015
- Paid search growth at least equal to the 10% increase in this year’s paid search budget
- Increase in qualified lead conversions equal to our company’s sales growth target of 8% for 2015
Would it be appropriate to use Google Analytics’ benchmarking report as benchmarks for KPIs or goals? In a nutshell, no!
Implementation Differences vs Actual User Experience on Your Site
There are many reasons why Google Analytics’ benchmarking reports should be used very, very carefully, such as:
- In the example above, we identified that the simplest metric in the report – sessions by channel – could be different merely because we have not used campaign tracking parameters. This is an implementation issue; not a performance issue.
- Bounce rate — a great metric for comparing our site’s performance over time and across segments — should not be compared to other sites’ bounce rate because:
- Because of design decisions, bounce rates can be very different. Our site may have many long scrolling pages which would lead to a high bounce rate, while our competitors may have multiple pages that cover similar content or
- For our long scrolling pages, we’ve implemented an interaction event to measure how far the user scrolls down the page. Even though our competitors also have long scrolling pages, they may not have implemented a similar event. Because of this difference in Google Analytics implementation, our bounce rate would be lower. In this case, also, users have the exact same experience; our implementation decisions are driving the difference.
It is tempting to say (using the report above): “We are awesome! Our bounce rate is 6 percentage points lower than our peer group! Bonuses for everyone!” This would be bad analysis.
For reasons like these, E-Nor recommends thoughtful caution when using the metrics in Google Analytics’ benchmarking reports.
Google Respects Your Privacy
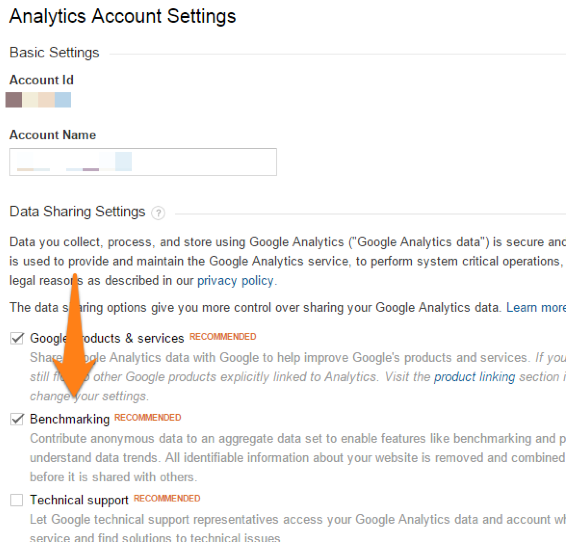
In order to access Benchmarking reports, you need to give Google access to your data in the Admin panel at the Account level by checking the box next to Benchmarking as shown in this image.
Also, as noted to the right: All identifiable information about your website is removed and combined before it is shared …
This also means that you cannot find out which other websites are in the peer group you choose.
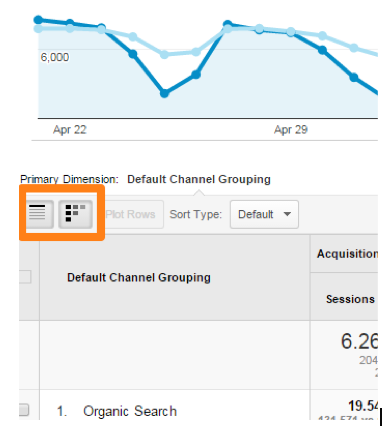
TMI?
If the benchmarking report is too busy visually, the metrics and heatmap visualization can be toggled off using these buttons:
Sources
Google Analytics Support for Benchmarking Reports
Google Analytics Blog Announcing Benchmarking Reports


