Have you ever jumped into your mountain of data and reports, only to be perplexed by certain spikes or troughs in your charts that occurred a while back. Then doing what any good analysts would do you segment the data, you compare it over time, you check your past analysis… only to find out that what you are investigating was a result of a campaign that you weren’t aware of (either you weren’t told about it and/or it wasn’t tagged properly) or your servers were down at that time or the GA tagging was inadvertently removed, an update was pushed live, a new product was launched, holidays (cyber Monday), or even weather…
Google Analytics has a solution for this problem and it is called Annotations (for charts). Annotations are a very powerful tool for the web analyst, and one that is very under utilized (even when people actually use it). Google Analtyics’ Annotations allow you to add up to a 160 character explanation of an event or happening for a specific day. If need be, and trust me you should often need to, you can add more than one Annotation per day.
Adding Annotations
To add an Annotation is very quick and easy. First you expose the Annotation interface beneath the chart.
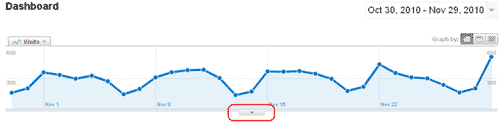
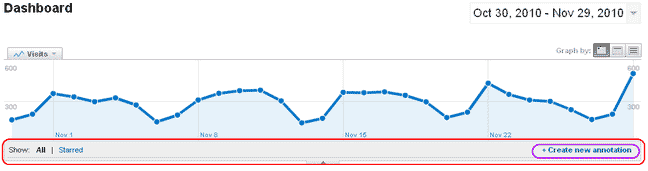
If you have made any Annotations yet you won’t notice much. What you will see is an expanded grey area beneath the chart with the ability to show all or just Starred Annotations, and on the far right you will see a link to “Create new annotation”.
Once you have clicked on the “Create new annotation” link you will see the following.
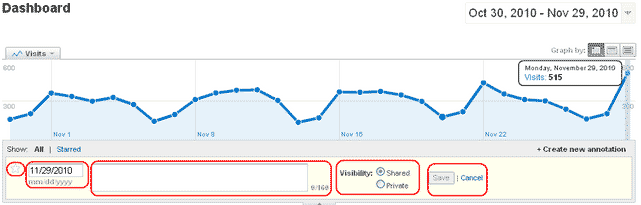
Now you will see that there are 5 quick steps to creating an chart Annotation in Google Analtyics.
- decide whether or not you want to “Star” this annotation or not. If you choose to “Star” it you will be able to filter it in the future so that it is viewed with all of the other ‘”Starred” Annotations (and not the unstarred ones). This is a very handy feature once you have a lot of Annotations (and I know you will once you start using them). Starring an Annotation is usually done when then Annotation is explain an important event, or one that has had a dramatic impact on the chart.
- Selecting the date. This is where you select the date which your event to place and thus where it will be placed on the timeline.
- Here is where you can enter up to 160 characters to describe your event
- When creating an Annotation you not only have the ability to star it or not, but you also have the ability to Share it with others. This particular feature is what makes Annotations particularly powerful. Now you can let everyone else who has access to this report read your annotation (annotations are specific to reports within a given profile). This can help save you tons of time when doing your analysis as if annotated properly many of the questions that you might want/need to dive in and answer will be answered in the annotations.
- Finally you need to either save or cancel your annotation.
Viewing Annotations
To view your annotation click the down arrow beneath the chart. When viewing you annotation you will see all annotation for the time period of the chart, their dates, description, and the email address of account that made the annotation. If you need to you can also go back and edit your annotations (you can’t edit someone else’s annotations). If you click on the ‘edit’ link you are brought back to the same interface that is used when creating your annotation. At this point, you can make changes or delete your annotation. You will also notice on the horizontal axis of the graph a tiny icon letting you know that an annotation has been made for that day.

Now you know the basics of creating, managing and reviewing annotations its time to start using them. Remember it is always easier to add your annotations as you go, instead of coming back later when it is hard to remember what happened. That being said if, when doing your analysis, you uncover explanations for the peaks and troughs, or the events that created them, go back and add the annotation and share it with others.


