
Earlier this year, we were planning to celebrate my son Sohum’s birthday in the last week of January. A few days before our plans, a weather forecast alerted us to a historic weather event with a massive polar vortex set to hit Chicago and much of the Midwest. Fortunately, due to solid weather forecasting, we knew this crush of sub-zero air was on the way. As a result, instead of getting stuck in dangerously cold weather, we were able to turn our plans into a low-key, snowed-in celebration watching Spiderman 🙂

This same model of planning through forecasting can be applied to your business and marketing strategies to safeguard your organization against any sudden market storms, and more accurately allocate budgets, plan resources, and adapt to changes that can impact your business.
Marketers are especially well-positioned to provide business stakeholders with forecasting that can have enterprise-wide implications. With a view into early-stage revenue cycles – from leads to customer journeys, to engagement scoring, conversions, and lifetime value – marketers are able to draw upon a broad set of data to build out forecasts based on historical and present conditions.
Background: What is Forecasting

Forecasting, at its core, is a planning technique that relies on historical data to produce informed, predictive estimates based on trends, seasonality and various business factors. Forecasting plays a vital role in various fields and is an essential tool in allowing a business to adjust to a constantly shifting marketplace.
At Cardinal Path, we employ a wide range of forecasting techniques, allowing us to tailor the best-fitting approach to each specific client problem. As an example, for a large U.S. retailer, we applied neural networks to accurately forecast website and business metrics on a monthly and annual basis. We data scientists can forecast pretty much anything as long as the historical data is available, but not all forecasts are equally important or relevant. Depending on the business question that you are looking to solve, a single or subset of the key performance indicators (KPIs) may be all you need to forecast. For this retailer, we forecast key performance indicators such as website appointment bookings, quotes, visits, calls and store locator clicks, arming them with powerful predictive insights to plan their budgets and activities for maximum impact.
Once you have defined the key performance indicators, then next step for a data scientist is to gain adequate understanding of various factors impacting the business KPIs. Some questions to ask: What type of product and KPI metrics are we forecasting? whether that KPI shows a particular behavior that we need to account for? Does seasonality impact the trend significantly? Is all the available data representative for the current business situation? How does media spend across channels impact the business? What other external factors affect our business, e.g. weather, stock market, employment, etc, Once we understand various factors, next step is to accurately capture this data across a time period. A 2-3 year historic data across all input factors and KPI metrics helps us build a solid forecasting model with accurate evaluation of seasonality impact on business.
The complexity of forecasting algorithms ranges from simple moving averages to highly sophisticated data-driven machine learning algorithms. Popular forecasting methods include Box-Jenkins time series methods such as ARIMA to machine learning algorithms such as Neural Networks and Random Forest. Most of this algorithms are available readily in standard statistical programming languages such as R and Python. Which forecasting model approach is ideal for your business depends on the challenge at hand, the complexity of trends, and available resources.
The Neural network is a popular industry standard machine learning algorithm. The basis of Neural network algorithm is in classical machine learning that attempts to mimic the neural network in the human brain for pattern recognition and prediction. The complex algorithm maps the variation of various input data factors to produce forecasted values.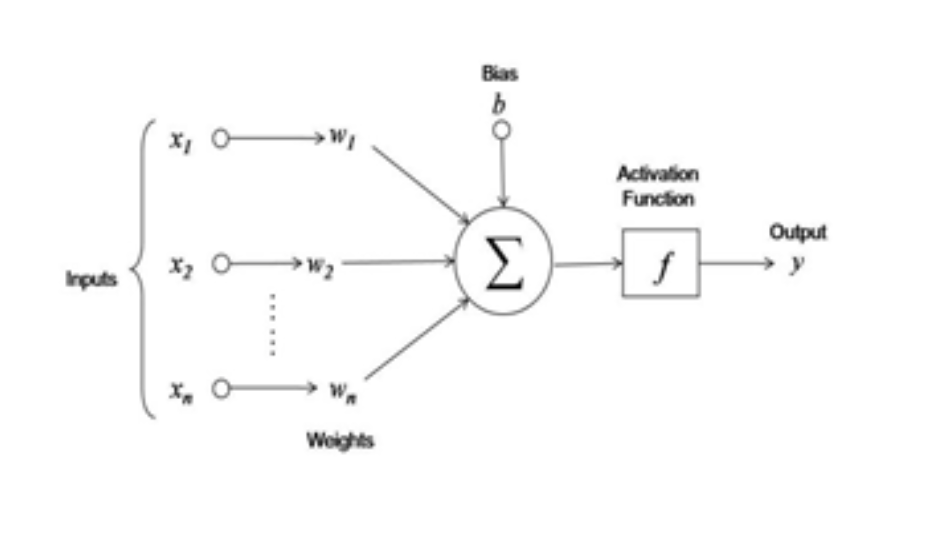 The general flow of a neural network algorithm used in forecasting is represented by the schematic diagram. Inputs (x1, x2…xn) represent various input data factors which are modeled using a predictor function to output particular business KPI metric (y). The model is developed on a training data subset and then validated on a test dataset for predictive accuracy. The algorithm produces very good accuracy in terms of forecasted values of various metrics
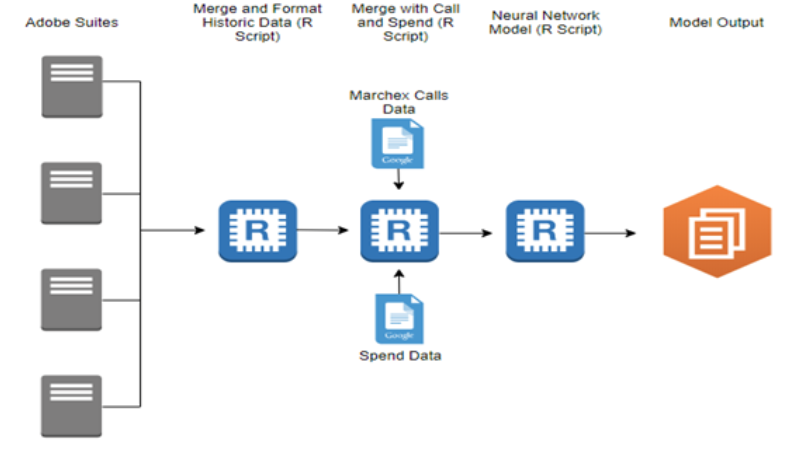
Neural networks form the foundation of learning models used in various industry applications including forecasting. The following process diagram below provides the process flow of various data elements integrated together to build the forecasting model.
We perform validation of the forecasting model by comparing actual vs. forecasted values for each of the KPIs. A good modeling process should produce forecast estimates for the business KPIs within an acceptable error range (5 to 10%). Once developed, the forecasting process is automated with data flows from various API’s. The model process is continually tested and validated for improvements based on changes in market conditions. This allows for regular forecast updates (monthly, quarterly) based on the needs of the business for planning and marketing activation.
So, in the same way I was able to avoid a polar vortex in Chicago with a solid daily weather forecasting model from accuweather.com , we can help marketing organizations use forecasting models to ensure they’ve got a clear view of the future, so they can adjust their approach to make the most of what lies ahead. And of course weather can be added as one of the input variables to the model evaluate its impact on your business.
Do you have questions about forecasting or other data science solutions? Contact us at info@cardinalpath.com.
Amit Jai Kadam “AJ” is Director of Data Science at Cardinal Path.