At the 2018 Tableau Conference in New Orleans, the overarching message to Tableau users and customers was clear: “We hear you.”
As someone who is continually looking for ways to push the limits on dashboarding capabilities, I love how attentive Tableau is to customer feedback, which is evident in their frequently released product updates.
I decided to take a closer look at some of the features we at Cardinal Path are most excited about: Ask Data, a GoogleAds connector, and Tableau Prep Conductor.
Ask Data
When “Ask Data” was first displayed, there were many “oohs” and “aahs”. This new feature allows users to publish a data source to their instance of Tableau Server or Online, and create vizzes or generate insights on the fly via Ask Data’s natural language processing (NLP) capabilities. I was intrigued but also wanted to try it out for myself to determine how it would be used in a real business environment, as opposed to a carefully curated demo.
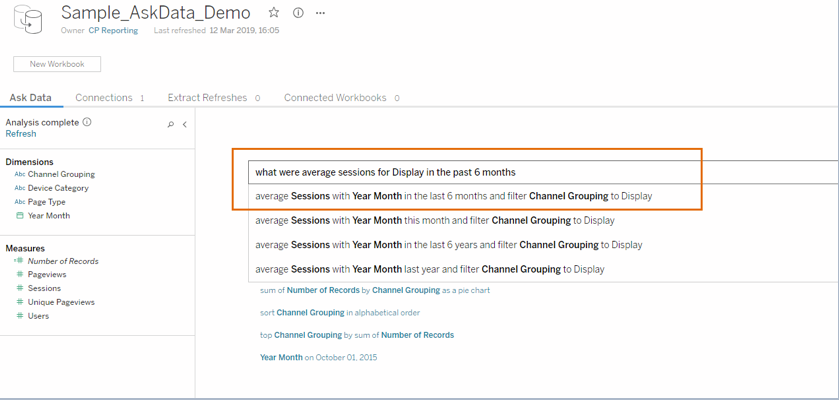
I gave it a go on Cardinal Path’s own instance of Tableau Online, publishing a sample data set and “asking” questions like: “What were average sessions for ‘Display’ in the past six months?”
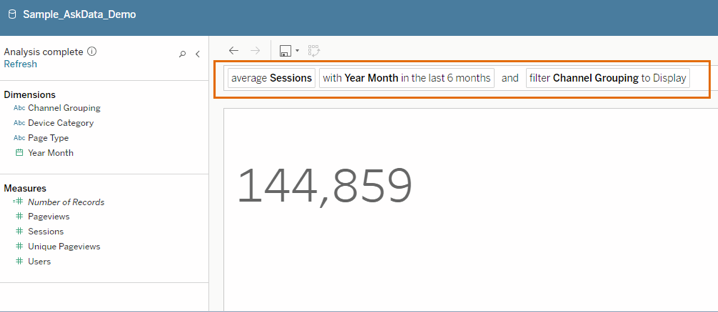
Ask Data was able to recognize that ‘Display’ was a line item in my Channel Grouping dimension, and understood that I wanted to know the average number of sessions for that specific channel in the past six months. When I click the first option on the dropdown, it returns the number I’m looking for. Pretty impressive!
When I tried to do some more advanced queries (note the current version of Ask Data does not yet support table calculations, which can be somewhat limiting when it comes to more advanced data analysis), I did run into more trouble trying to get Ask Data to understand what I wanted. The main reason being that I wasn’t always sure on the best way to phrase my query in a way that Ask Data would understand.
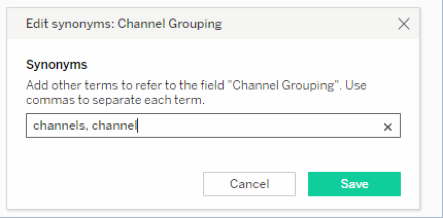
An example of a failed query was when I wanted to see in which months the sum of page views for a specific page type exceeded 10K. It wasn’t until I made some edits in the output interface, that I was able to see the results I was expecting. That being said, there is the option to teach the algorithm to improve, such as by adding synonyms for field names.
Ask Data is also able to recognize more ambiguous terms like “recent,” or “most popular” and will adjust its suggestions accordingly. To top it all off, it’s able to run on both extracts and live data sources on both Tableau Server and Online. Ask Data is still in its early stages, and for now, it may be too limited to work with messy “real-world” data or perform more advanced queries. However, we’re excited to see the steps Tableau is taking towards incorporating NLP and AI into their products.
Google Ads Connector
Since Cardinal Path is a Google partner, we’re also excited to see Tableau continue to offer integrations with the Google Marketing Platform; notably, a Google Ads integration in addition to the already existing Google Analytics API connector.
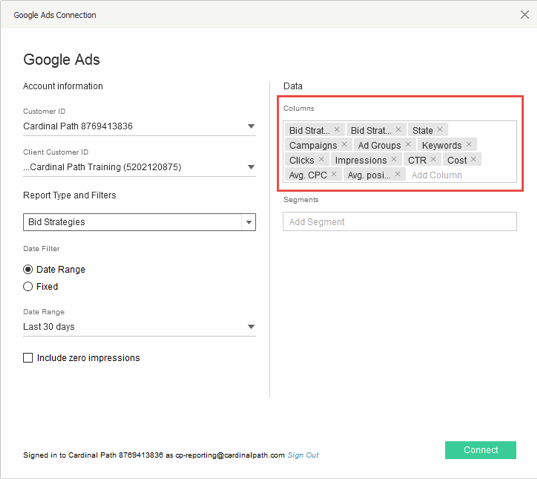
As with the GA connector, configuring your data is made very simple, with the option to select your customer or client customer ID, the report type, date range, and the opportunity to customize a pre-selected report by adding or removing columns.
For clients who want to see their Ads and Analytics data in one workbook, or want to avoid the hassle of having to export Ads data into a different platform first, this connector helps bridge the gap.
Tableau Prep Conductor
Tableau Prep remains a lesser known product since it was brought to market early last year, though our experiences with the tool have been positive so far. Tableau Prep allows you to set up a process to transform and prep data, often from various data sources, before generating output files that you can connect to it in Tableau.
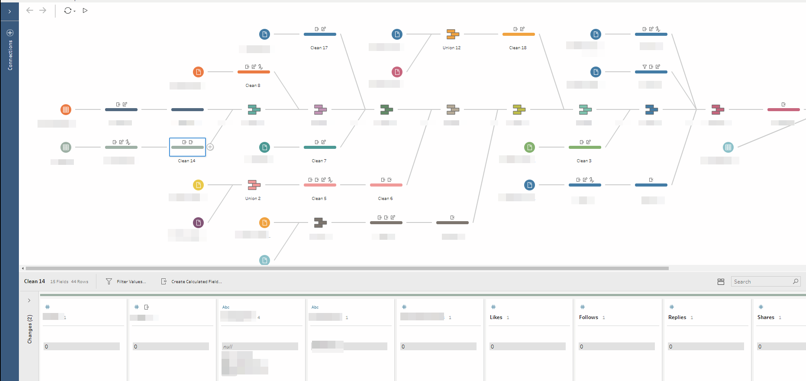
Sample prep flow:
With Tableau Prep conductor, there is the option to create and publish an entire flow to your instance of Tableau Server or Tableau Online, and schedule it to run in a similar fashion as data extract refreshes; eliminating the manual process of running your flow.
Having the ability to run (and share) your entire data transformation process on any desired cadence is a powerful addition to Tableau Prep. Note that the conductor tool is an add-on and must be purchased separately as part of the Tableau Data Management Add-on.
There are many more new features released in 2019, such as improved mobile compatibility (including a completely revamped mobile app), the ability to export published workbooks to PowerPoint, and more. In the meantime, we’re looking forward to checking out the cool new features in 2019.2 such as Vector maps and Parameter Actions.
More about data visualization solutions.
For a while, traffic from AI platforms like ChatGPT, Gemini, and Claude lived in an…
Our team is heading to San Francisco March 3-5 for RampUp 2026. We'll be meeting…
The rise of browser-based Opt-Out Preference Signals (yes, OOPS) is quietly reshaping online consent experiences.…
This website uses cookies.