
We used to hear “mobile is the future.” Then, we started to hear the phrase, “Mobile Now.” Finally, “Mobile First” is the reality. While this is great for consumers, as we have access to great apps and services literally at our finger tips, marketers are now challenged to keep up with new user-experiences, new platforms, mobile development, and yes, you guessed it, new mobile analytics! But, hey, no one said life in the fast lane was easy 😉 And, when you need mobile insights in a jiffy, you’re naturally going to look at real-time reporting. Don’t get ahead of yourself though – it might not be what you expect.
Mobile Analytics vs. Standard Desktop Analytics
Just as mobile user-experience and mobile marketing have pushed beyond the familiar features and functionality of the traditional web, so does mobile analytics. General analysis concepts such as segmentation, acquisition, behavior, conversion etc. still very much apply to mobile analytics. But there are foundational mobile concepts that marketers should adopt and do so quickly.
Don’t waste any time before getting comfortable with these:
- Tracking activity in a mobile app, in Google Analytics for example, requires a mobile SDK (and yes, you can use the Google Tag Manager for mobile).
- Screens. Don’t get caught saying pageviews. Pages are for browsers.
- Events and more Events for all your user interactions. No browser, no hyperlinks. Explicitly define every Event.
- Crash and Exception reports. You won’t need these? Yeah, right.
- Metrics like Installs (App installs) and IAP (In App Purchases).
- Mixed Web and Mobile data for similar user interactions – like when a user logs in at amazon.com to shop and later uses their Amazon iPhone app to make a purchase. It’s a multi-screen world, folks. Let’s track it.
These aspects will be the subject of another post, but I’ll share a taste of what is going in Mobile Analytics.
Google Analytics recently made a User Interface change and updated some metrics to work across desktop and mobile. Visitors are now Users and Visits are now Sessions. A needed switch as we begin to use the internet in browserless ways.
Real Time Reports
What about reporting? Take a look at Real-Time reports. In GA for web, Real Time reports show you data about your users as they traverse the site (after a few seconds of delay). How does Real-Time Reports work for Apps? Slightly differently. We’ve isolated the data in the following examples to highlight the differences.
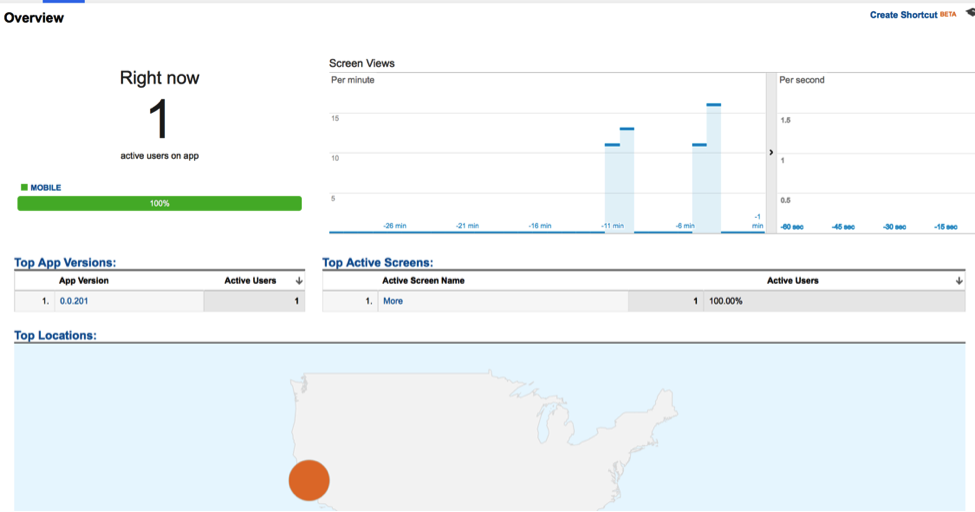
In the Overview Report, you see how many active users there are, how many screen views the app is getting “Per Minute” and “Per Second”. The metrics work in the following ways:
Scenario one:
- The app is started; the user navigates through number of screens and icons, links. Events are generated in GA.
- After waiting, nothing shows up in the “Per second” window.
- You escalate to your developers, they check the code and the GA View configuration and it’s all solid.
- You run the test again. You watch closely. In two minutes, activities appear in the “Per minute” window showing activities that happened two minutes earlier (see first snapshot below). Huh? What happened?
- This is as Real-Time as you are going to get. Not good? Sorry 🙁 It’s by design. Stay with me as we learn why.
Data Dispatch
In Mobile Analytics and in our specific GA example, there is a concept called data dispatching, as defined by Google “As your app collects GA data, that data is added to a queue and periodically dispatched to Google Analytics. Periodic dispatch can occur either when your app is running in the foreground or the background.” Dispatching is used to reduce overhead, increase battery life, etc.
In the iOS, the default dispatch is 2 minutes (and you can adjust it to your liking).
https://developers.google.com/analytics/devguides/collection/ios/v2/dispatch
For Android, the default dispatch is 30 minutes (and can be adjusted as well).
https://developers.google.com/analytics/devguides/collection/android/v4/dispatch
Other analytics platforms such as Flurry have similar concepts.
Scenario two:
- The app was started; a number of screens and events were clicked on.
- The app was killed—all within less than 2 minutes. The activities showed up right away in the Per Second window.
- After a minute or 2, the activities showed up in the Per Minute window as shown below.
- Why did the activity show up within less then 2 minutes in the Per Seconds and (pretty much less then 2 minutes) in the Per Minute window?
The way Data Dispatch works is that there is a set delay in which the activity is transmitted. However, if the app is terminated before that time frame, data will be submitted immediately. Thus, in this scenario, because the app was terminated before the 2 minute mark, the data was submitted and (after some processing time) showed up in the Per Second window. In the minute window, of course, after the processing time and minute intervals, then you’ll the real time activity.
An active user is triggered when you start the app, as seen below. The snapshot was taken within 1 min of starting the app. Just remember only 5 minutes of inactivity will drop the user from the Active User report even though their activity will be present in the Per Minute report.
Conclusion
So be careful – the present world of mobile Google Analytics Real-Time reports is different from what you might expect from desktop Real-Time. What you see isn’t necessarily exactly live, but rest assured that the same hits that have appeared in standard (non-Real-Time) Google Analytics reports are still making their way to GA to appear in the reports (and in some new reports, too) in only a few hours.
Share with us your thoughts and comments!


