How the new Google Analytics Multi-Channel Funnel API led to marketing insights that rocked and rolled.
What has always set Google Analytics (GA) apart is its ability and ease of use to engage with and dissect the data (“slice and dice”) to uncover deep customer insights. Google has now “turned up the volume” on this aspect of GA through the newly released Multi-Channel Funnel (MCF) API. At Cardinal Path, we were fortunate enough to be able to work with one of our clients, Eric Klein, Digital Technology Manager at C3 Presents (the company that puts on the Lollapalooza festival and Austin City Limits among others), to use the new MCF API, to help surface how time and channel type affect Lollapalooza ticket sales. Our analysis – dubbed “MCF-DNA” – revealed some totally surprising findings, and underscored the power of this new API (in conjunction with Analytics Canvas and Tableau Software) to help digital marketers sift through large volumes of data to rapidly and easily reveal new marketing insights.
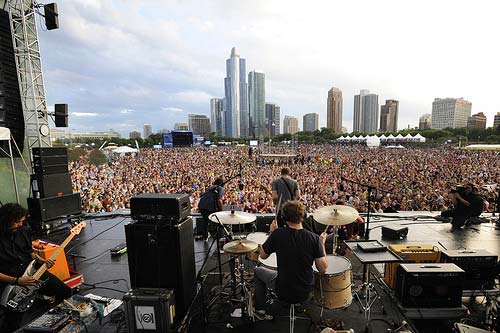
Gather 300,000 energized fans to Grant Park in Chicago, bring on Red Hot Chili Peppers, The Black Keys, Black Sabbath and dozens more on stage, and you get an extraordinary and exceptional sold-out event – Lollapalooza, taking place on August 3 – 5, 2012. We worked with C3 Presents, the event promoter, to uncover complex patterns of behavior in the channel mix. Here’s an example of what we uncovered.
“C3 Presents creates, markets, and produces live experiences, concerts, events and just about anything that makes people stand up and cheer.” Although Google Analytics provides lots of insight, C3 Presents had an interesting question:
“I’d love to learn if there is something different about people who bought the first week of sales vs. the rest of the time. My assumption is that some channels are more effective than others at different points in time in enabling these customers to find out and buy earlier. How can I get the people who don’t buy immediately to buy sooner?”
Using Google Analytics new Multi-Channel Funnel Conversion Interaction API, Analytics Canvas ETL, and Tableau Software for advanced analysis, we were able to tackle the challenge – and more! The analysis involved three main steps:
Some patterns were confirmed, and new insight was uncovered:
This initial analysis highlighted the benefits of doing deeper research into year over year and comparing various events. Timely and specific messaging through each social media outlets could lead to earlier sellout of the events. Social media plays a huge role in influencing potential buyers who might discover/discuss on Facebook, Twitter and other social outlets, and eventually turn to the website to complete their purchase. Multi-Channel Funnels analysis reveals the role of social media as a clear and undoubtedly key component of the overall show experience and how they assist ecommerce conversions.
“The initial analysis was great. I’m very interested in getting Tableau Software and Analytics Canvas asap. I also want to start budgeting extra funds for Cardinal Path analysts. They are geniuses and great to work with.”
Eric Klein, Digital Technology Manager at C3 Presents
For a while, traffic from AI platforms like ChatGPT, Gemini, and Claude lived in an…
Our team is heading to San Francisco March 3-5 for RampUp 2026. We'll be meeting…
The rise of browser-based Opt-Out Preference Signals (yes, OOPS) is quietly reshaping online consent experiences.…
This website uses cookies.