Yesterday was the 2nd Republican Debate of 2016. Even though it lasted 3 hours, time flies when you’re having fun! With personalities like Donald Trump often setting the tone and direction with his charged statements and views, this year’s Republican debates puts the entertainment in politics. It was full of “zingers” and sparring, from domestic/international policy disputes to even candidates criticizing each others’ appearances. Yet for some reason, the night ended in high-fives between competitors – go figure.

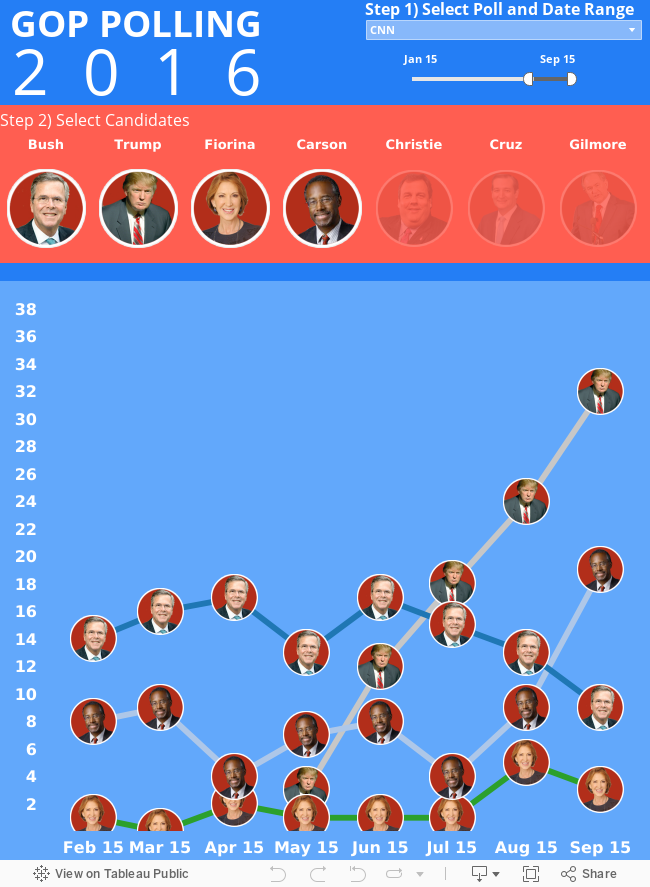
At E-Nor, we love to make numbers and reports dance visually – it makes it easier to tell a story. One of the great data-visualization tools is Tableau Software. Just for fun, we took polling data from the Huffington Post, which aggregated it’s statistics from different polling sources and made it into the below interactive data visualization.

  • Select a pollster and date range. Ex. CNN or Fox News :).
  • Select a candidate (select multiple candidates by holding down “command” on a mac, “control” on a pc).
  • You can also select a candidate in the graph to highlight their progress by clicking on them directly.

See their ascent (or descent) in the polls!

*(Huffington Post hasn’t updated the data in a couple days, but will update viz as data comes in!).

Message Sent

Thank you for registering.

Cardinal Path hosted a live session to connect with you and answer all your questions on Google Analytics.
Get all the expertise and none of the consultancy fees in this not-to-be-missed, rapid-fire virtual event.

Thank you for submitting the form.

Thank you for submitting the form.

Message Sent

Thank you for registering.

Message Sent

Thank you for registering.

Message Sent

Thank you for registering.

Message Sent

Thank you for registering.

Message Sent

Thank you for registering.

Message Sent

Thank you for registering.

Message Sent

Thank you for registering.

Message Sent

Thank you for registering.

Message Sent

Thank you.

Click here to download access the tool.

Message Sent

Thank you for registering.

Message Sent

Thank you.

Message Sent

Thank you.

Message Sent

Thank you

Message Sent

Thank you

Message Sent

Thank you.

Message Sent

Thank you

Message Sent

Thank you.

Message Sent

Success!
Your message was received.

Thank you.

Thank you for registering.

Cardinal Path is continuing with its series of free training. Next we are conducting training on Google Data Studio. Check it out here.

Message Sent

Thank you for registering.

Thank you for your submission.

Your request has been submitted and a rep will reach out to you shortly.

Message Sent

Thank you for your interest.

Thank you for registering.

You should receive a confirmation email from GoToWebinar with your unique webinar login information. If you do not receive this email or have trouble logging in to the event, please email asmaa.mourad@cardinalpath.com.

Thank you for subscribing!

You're now looped into the world's largest GMP resource hub!

Thank you for your submission.

Thank you for your submission.

Thank you for your submission.

Thank you for your submission.

Message Sent

Thank you for registering.

Message Sent

Thank you for your submission.

Thank you for your submission.

Message Sent

Thank you for registering.

Thank you for registering.​

Paid media spend by Government websites increased a whopping 139% YoY in 2020.

2020 Online Behavior Live Dashboard

Message Sent

Thank you for registering.

Message Sent

Thank you for registering.

Message Sent

Thank you for registering.

2020 Online Behavior Live Dashboard

Thank you for your submission.

Message Sent

Thank you for registering.

Message Sent

Thank you for registering.

Message Sent

Thank you for registering.

Message Sent

Thank you for registering.

Message Sent

Success! Thank you
for reaching out.