 A couple of weeks ago, I wrote a post about marrying qualitative and quantitative data, giving recommendations on how to conceptually combine both types of data for more useful insights. For the savvy marketers and the analysis ninjas out there, you want a tighter integration, and of course, more segmentation on the qualitative data. Visitors told you “No, I didn’t accomplish what I came to the site for” and “that pricing was too high”. Now, maybe you want to know…
- …where these “No’s” and “Yes’s” are coming from
- …what content they are consuming
- …what campaigns are driving these segments so you optimize at the source
In this post, we’ll cover this – the insights you can get from a direct integration of Google Analytics and Qualaroo.
Google Analytics – Quantitative Data Tool of Choice
It’s no secret that Google Analytics is our web analytics platform of choice. It’s a “monster” when it comes to providing web usage stats. It’s the gold standard. And as far as pricing, the cost benefit is unbeatable – it’s free (and if you want more data and enterprise analytics consulting, Google Analytics Premium is there for you). When planned and implemented right, you can get a wealth of qualitative data on your website – what pages are visited, where they come from, what keyword they searched for, how long they stayed, who converted – etc etc etc.
Qualaroo – Non-Invasive Voice Of Customer Survey
As far as qualitative data, Qualaroo can be your best friend. As an internet surfer, I’m sure your feelings are consistent with the rest of the world – forms and surveys are kind of annoying. They’re long, tedious, and often a waste of time. What we like about Qualaroo is how non-invasive it is. A small question will pop up and a visitor has the option of quickly answering it, or quietly dismissing it. We feel this increases the likelihood of it being answered.
We also love its configuration flexibility. “Nudge” the question after 30 seconds. After a visitor has visited 2 pages. Publish the survey from a certain date, shut it off after a certain date. Display only on certain pages. Etc.
Note: to integrate Qualaroo data in Google Analytics, you need to sign up for Qualaroo’s enterprise edition.
Google Analytics and Qualaroo Integration
With the ability to integrate Qualaroo data into GA, you now have a very powerful surveying, measurement tool. You can see “what’s” happening on your site by looking at the Google Analytics metrics. Then, with Qualaroo integrated into Google Analytics, you get a deeper understanding about “why”. Google Analytics itself will tie the connections between your qualitative data and quantitative data, between your “what” and “why”.
ROI by Channel
Here’s a simple example. Your company sells a SaaS product targeting CMOs and Marketing Managers at medium and large companies. You have your paid search campaigns running on AdWords and Bing and you want to expand into new paid social ad campaigns. You have ads on the following social networks:
Your landing page is converting, but it’s not converting like it should be, and you’re looking to really cut down your ad spend and optimize ROI. Your quantitative numbers tell you the following:
- Your spend is about equal (budget was set by yourself).
- There actually is a lot of traffic from Facebook and Twitter and LinkedIn.
- However, it looks like you are getting very few conversions.
- You wonder:
- “Why is that?”
- “Should you continue spending on these channels?
- If you shut down these campaigns, what opportunity are you missing?”
Thus, we add the following survey:
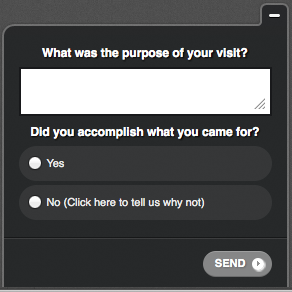
Your goal is to understand what’s happening and why your visitors can’t find what they are looking for and thus not converting. With Qualaroo Enterprise version enabled, some cool Qualaroo event user interaction can be reported in GA (an event is fired based on user interaction with the survey). The image below shows the number of events when responders answer “No, we didn’t accomplish what we came here to do”. Here is what we see in GA (go to Content –> Events –> Top Events –> and then click on the Qualaroo Enterprise Event Category):
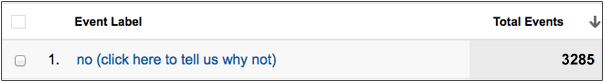
Your first reaction is :(, so many people (and a high percentage of the total responses) can’t find what they are looking for, no wonder they are not converting. Time to dig deeper and segment.
As we know, once you have the event captured in GA, you can make it a goal or segment on it in whichever way you like. In our case, we want to understand where the No’s are coming from. Let’s take this specific event and segment the report by channel (apply secondary dimension to the Top Events Report) and voila! You have the channels responsible for driving the unengaged visitors.
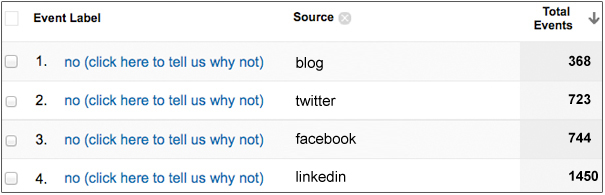
In the snapshot above, you see LinkedIn is a potential culprit here. We love LinkedIn and we’d expect it to generate high value leads, what’s going on here? Our paid ad LinkedIn campaign appears to be bringing visitors who are not interested in the SaaS product. After verifying the statistical significance (and correlating the number of “no” events with the traffic volume from the respective source) and looking at some of the survey responses, so of the answers to tell us why you didn’t find what you came here for were very revealing, here is a sample of these answers, once you read them, you’ll know exactly why the campaign is not converting.
- “I can’t find the technical product description”
- “your product appears to be solid, but I am interested in customization features and API import/export capabilities”
- “how technical does the system admin need to be, I can’t tell from the info provided”
- “I am a system admin and I need to know your system up-time and technical support you provide, can’t find this information”
Most of the answers/comments were of a technical nature, and appears to come from IT folks and your LinkedIn ad campaign (including the landing page) is all designed around speaking to the CMOs!
These insights are very actionable. Two immediate actions are now taken to adjust our targeting options, and really optimize our ROI (by maybe putting our budget towards these better channels).
- Cost savings: Enhance the LinkedIn targeting to marketing managers
- New opportunities: create a new campaign/new landing page with information requested for the IT folks.
ROI by Keywords
Now, say you’re spending on Google AdWords. You really want to know if specific campaigns or keywords are driving the traffic and unengaged visitors.
Again, we take the specific event and segment the report by keyword (apply secondary dimension to the Top Events Report) and voila! You have the culprit keywords.
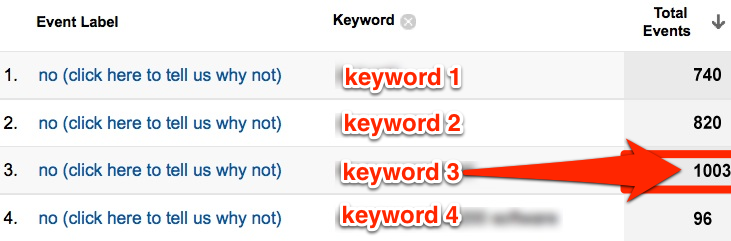
Is this super insightful or what?! (keywords blurred to keep our clients identity anonymous…)
Stop bidding on these keywords or direct traffic from these keywords to a lower price-point product and see your sales go up like you’ve never seen before!
—
Here you have it, if you feel like you are hitting a wall and not sure what to do to improve your conversion rate, go back to the basics and “listen to your customers”!
How have you used voice of customer tools to improve your site and campaign performance? Very interested to hear your stories.


